Sensors & Field Instruments
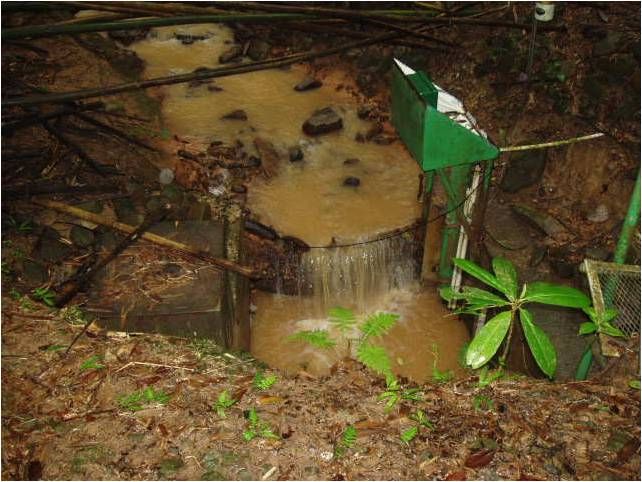
Atmospheric sampling nodes consist of 8 weather stations and an additional 8 rain gages that will monitor climatic and geochemical inputs to the different lithologies and forest types across a precipitation gradient that ranges from 1000 mm/yr to 5000 mm/yr. Additional aquatic nodes of the observatory focus on quantifying the fluxes of water, sediment, and solutes from the basin and how they are transformed as they move from pore spaces in the lithologic matrix to the coastal zone. These nodes include 8 stream gages and numerous georeferenced cross-sections and riparian sampling sites.
Infrastructure
The basic infrastructure of the LCZO is an integrated set of sampling sites (e.g. nodes in Table 2). These sampling sites are built upon existing study sites that have long-term and ongoing records of rainfall, throughfall, litterfall, and streamflow (Schellekens et al 2004, Peters et al 2006, Heartsill et al 2007, Wei et al 2007). Atmospheric sampling nodes consist of 8 weather stations and an additional 8 rain gages that will monitor climatic and geochemical inputs to the different lithologies and forest types across a precipitation gradient that ranges from 1000 mm/yr to 5000 mm/yr. Atmospheric inputs are monitored at existing climate stations that are maintained by the LCZO with support from the USGS, the USFS, and UC Berkeley. Although these stations cover the entire matrix of elevation, lithology, and forest types, most of these stations were established with previous funding that no longer exists. LCZO funding has been used to upgraded, calibrated, and integrated these stations into a network that for the first time constrains variations in precipitation along the elevation gradient and thereby improves water budgets for the individual study basins.
Aquatic nodes of the observatory focus on quantifying the fluxes of water, sediment, and solutes from the basin and how they are transformed as they move from pore spaces in the lithologic matrix to the coastal zone. These nodes include 8 stream gages and numerous georeferenced cross-sections and riparian sampling sites (see Phillips, Litwin, Malvadkar write-ups in this volume). A major limitation to previous studies has been the ability to monitor storm events and temporal variations in exports. To overcome this limitation, the LCZO has added temperature, conductivity and turbidity sensors to existing stream gages to obtain continuous records of conductivity, and temperature (Shanley et al 2008). Water chemistry is sampled weekly and during coordinated sampling campaigns (see Occhi in this volume). All samples are processed at the USGS WEBB laboratories and at the University of New Hampshire in collaboration with the Luquillo LTER site.
For specific details regarding datasets and sensors used at specific sites please visit us at https://www.sas.upenn.edu/lczodata
|
Study Site |
X |
Y |
Elevation [m] |
Measurements |
Frequency |
Length of Record |
Website |
|---|---|---|---|---|---|---|---|
| Climate Stations | |||||||
| East Peak | -65.763838 | 18.279714 | 989.0 | Precip, Temp & radiation, wind,chemistry | Daily, hourly avg, total, max, min | 2002-present | omayol@ites.upr.edu |
| East Peak UPR African Dust | -65.757888 | 18.2679323 | 1027.7 | Visibility, Dust Chemistry | Continuous and event based sampling | 2010-present | omayol@ites.upr.edu |
| Bisley Meteorlogical Tower 1 | -65.74491 | 18.314406 | 352.0 | Precip, Temp & radiation, wind, chemistry | Continuous | 1987-present | Luquillo-CZO@sas.upenn.edu |
| Bisley Meteorlogical Tower 2 | -65.746111 | 18.304444 | 481.9 | Precip, Temp & radiation, wind, chemistry | Continuous | 1995-present | USGS |
| Bisley Throughfall and Stem flow | -65.74491 | 18.314406 | 260-400 | 32 Bulk collectors | Weekly volume and chemistry | 1987-present | Luquillo-CZO@sas.upenn.edu |
| Sabana Field Station | -65.729763 | 18.324913 | 79.3 | Precip, Temp & radiation, wind | Continuous | 2000-present | USGS |
| El Verde Field Station | -65.81972 | 18.321055 | 447.4 | Precip, Temp & radiation, wind, chemistry | Continuous, NADP wet and dry collector | 1970's to present | msalgado@fs.fed.us |
| UC Berkeley Upper LM Climate | 700-1000 | 4 weather stations in elevation transect in upper Luquillo Mts | Continuous | 1994-present | |||
| USGS Stream gages | 200-640 | Precipitation gauges are located at most stream gages | 1990's to present | USGS | |||
| Stream Gages | |||||||
| Bisley Quebrada 1 | -65.74538 | 18.315717 | 261 | Discharge, temp, conductivity,chemistry | Continuous, weekly chemistry | 1987-present | Luquillo-CZO@sas.upenn.edu |
| Bisley Quebrada 2 | -65.74629 | 18.314637 | 267 | Discharge, temp, conductivity,chemistry | Continuous, weekly chemistry | 1987-present | Luquillo-CZO@sas.upenn.edu |
| Bisley Quebrada 3 | -65.747312 | 18.314091 | 265 | Discharge, temp, chemistry | Continuous, weekly chemistry | 1987-present | Luquillo-CZO@sas.upenn.edu |
| Rio Sabana at Sabana | -65.731111 | 18.331111 | 78 | Discharge, temp, chemistry | Continuous, weekly chemistry | 1979 to present | USGS |
| Mameyes, Puente Roto | -65.751111 | 18.329444 | 274 | Discharge, temp, chemistry | Continuous, weekly chemistry | 1967 to present | USGS |
| Quebrada Sonadora, El Verde | -65.8175 | 18.323333 | 373 | Discharge, temp, chemistry | Continuous, weekly chemistry | 1983 to present | USGS |
| Rio Icacos, Naguabo | -65.785833 | 18.277222 | 616 | Discharge, temp, turbidity,chemistry | Weekly Samples | 1945 to present | USGS |
| Quebrada Guaba, Naguabo | -65.788889 | 18.283889 | 640 | Discharge, temp, chemistry | Weekly Samples | 1992 to 2012 | USGS |
| Rio Grande, El Verde | -65.841667 | 18.345278 | 51 | Discharge, temp | Weekly Samples | 1967 to present | USGS |
| Rio Blanco, Florida | -65.785 | 18.229167 | 16 | Discharge, temp | Daily, 15 min time series | 1983 to present | USGS |
| Groundwater | |||||||
| Bisley Riparian Well Field | -65.747508 | 18.31651 | 221.0 | Network of shallow wells, slope to stream | Continious to event | 1987-present | Bill.McDowell@UNH.EDU |
| Icacos Riparian Well Field | -65.789003 | 18.281419 | 625.0 | Network of shallow wells, slope to stream | Continious to event | 1987-present | Bill.McDowell@UNH.EDU |
| USGS Icacos Lysmeter Field | -65.788496 | 18.281899 | 640.0 | Cup and plate suction sampliers and gas sampliers from surface to point of refusal | USGS | ||
| USGS Bisley Lysmeter Ridge Field | -65.742842 | 18.313686 | 409.9 | Cup and plate suction sampliers and gas sampliers from surface to point of refusal | USGS | ||
| USGS Bisley Lysmeter Slope Field | -65.74515 | 18.315854 | 282.6 | Cup and plate suction sampliers and gas sampliers from surface to point of refusal | USGS | ||
| Bisley Deep Observation Well B1W1 & 2 | -65.745772 | 18.315524 | 272.0 | Continious core samples, chemistry | Monthly and Event sampling | Luquillo-CZO@sas.upenn.edu | |
| Icacos Deep Observation Well | -65.788496 | 18.281899 | 640.0 | Continious core samples, chemistry | Monthly and Event sampling | Luquillo-CZO@sas.upenn.edu | |
| Rt 191 Deep Observation Wells | -65.7888895 | 18.284333 | 652.0 | Continious core samples, chemistry | Monthly and Event sampling | Luquillo-CZO@sas.upenn.edu | |
| Vegetation and Soil plots | |||||||
| Bisley Forest Litterfall | -65.74629 | 18.314637 | 260-400 | Litterfall mass and elemental fluxes | bi-weekly mass flux and chemistry | Bill.McDowell@UNH.EDU | |
| Bisley Long-Term Vegetation & Soil Plots | -65.74629 | 18.314637 | 260-400 | 84 permanent vegetation plots | Every 5 years | Luquillo-CZO@sas.upenn.edu | |
| UC Berkeley Upper Montane Vegetation, Soil, Litter Plots | -65.763838 | 18.279714 | 700-1000 | Litterfall mass and elemental fluxes | bi-weekly mass flux and chemistry | wsilver@berkeley.edu | |
| UNH Bisley and Icacos Fertilization Plots | 210-630 | Fertilized 2x per year, mass balances and fluzes | Established & managed by W. McDowell | Bill.McDowell@UNH.EDU | |||
| El Verde Long-Term Forest Dynamic Plots | -65.81972 | 18.321055 | 447.4 | 16 ha grid of identified and tagged trees, soils | Annual to event based | ||
| Luquillo Soil Network | -65.789797 | 18.300887 | 300-810 | 216 plots stratified by geology, topo, forest type | Once and project based studies | Luquillo-CZO@sas.upenn.edu | |
| UC Berkeley Bisley Instrumented Hillslope | -65.7487 | 18.3157 | 300.0 | Soil moisture and oxygen in 10 plots | Continuous | wsilver@berkeley.edu | |
| UC Berkeley Bisley catena soil plots | -65.7487 | 18.3157 | 260-400 | 60 soil plots stratified among four replicate ridge/slope/valley catenas | Once and project based studies | wsilver@berkeley.edu |
Explore Further
