Severe Rainstorm Effects Recorded in Streams and Groundwater Levels
An Extreme Rain Event and the Hydrologic Response in the Boulder Creek CZO
Persistent, heavy rain over Boulder during a 36-hour period between Sept. 11 and 13, 2013, produced an extremely large amount of preciptiation that broke 130-year old records for rainfall for one day, two days, one-week, and one-month since 1883. Here we present a snapshot of precipitation and hydrologic responses in the Gordon Gulch and Betasso sites in the Boulder CZO.
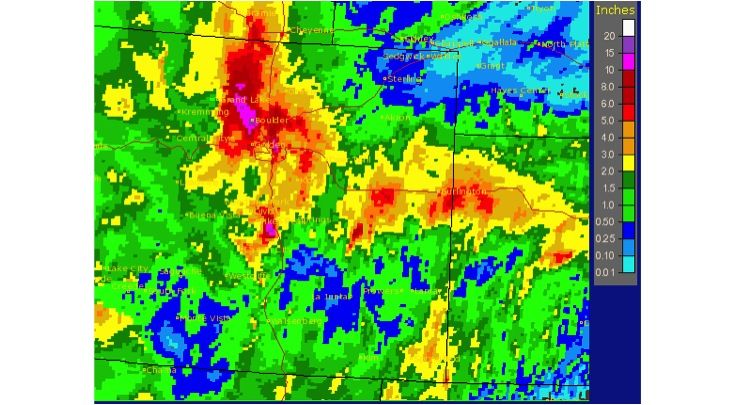
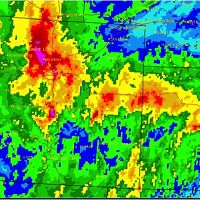
Fig. 1. Seven-day rainfall totals over Colorado, ending Sept. 13, 2013 (Image courtesy of the NOAA National Weather Service). Note that totals over the Boulder area exceeded 17 inches of rain in one week.
Boulder Creek Critical Zone Observatory
The Boulder Creek CZO monitors hydrology with a network of meteorological stations, groundwater wells, and stream gauges at three field sites in the Front Range of Colorado, stretching from the Continental Divide out to the Western edge of the plains. The Gordon Gulch site and Betasso site are located on tributaries to Boulder Creek, as seen in Figure 1. Water in these creeks eventually joins Boulder Creek which joins St. Vrain Creek and then the South Platte River, and further downstream, it joins the Mississippi River and flows into the Gulf of Mexico.
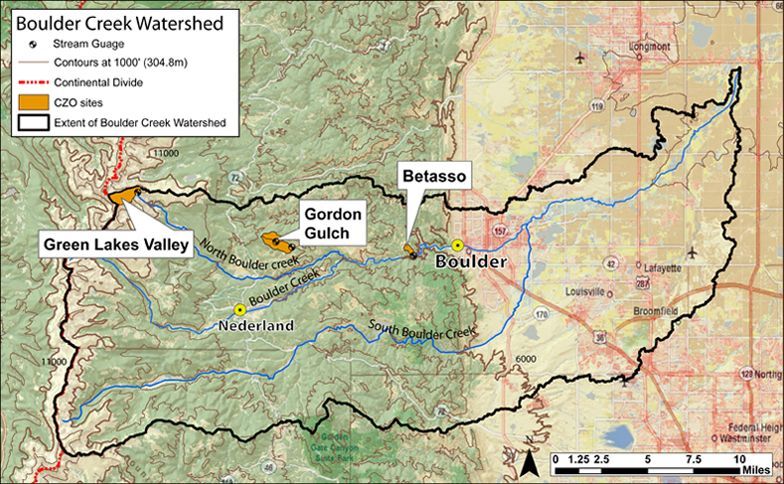
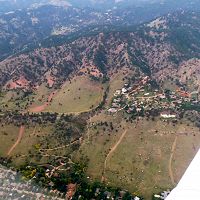
Fig. 2. The Boulder Creek CZO lies within the Boulder Creek watershed (1160 sq km), which drains the Front Range from the Continental Divide (4120 m) to the eastern Plains (1480 m). Our work concentrates on three research sites that span a wide range of elevation, climate, geologic history, and weathering regimes: Green Lakes Valley (3567-3745 m, 2.3 sq km), Gordon Gulch (2446-2737 m, 2.75 sq km), and Betasso (1810-2024 m, 0.45 sq km).
The Hydrological Response
At the Boulder CZO sites, we have five years of precipitation at the Betasso meteorological tower, and those records were shattered during the September storm. For the three years for which we have groundwater data at Gordon Gulch, the response of groundwater levels resembled those of spring snowmelt. One exception was that the water level in our south-facing Gordon Gulch Groundwater Well 6 exceeding previous records by about 1 m, for a total rise of about 4 m.
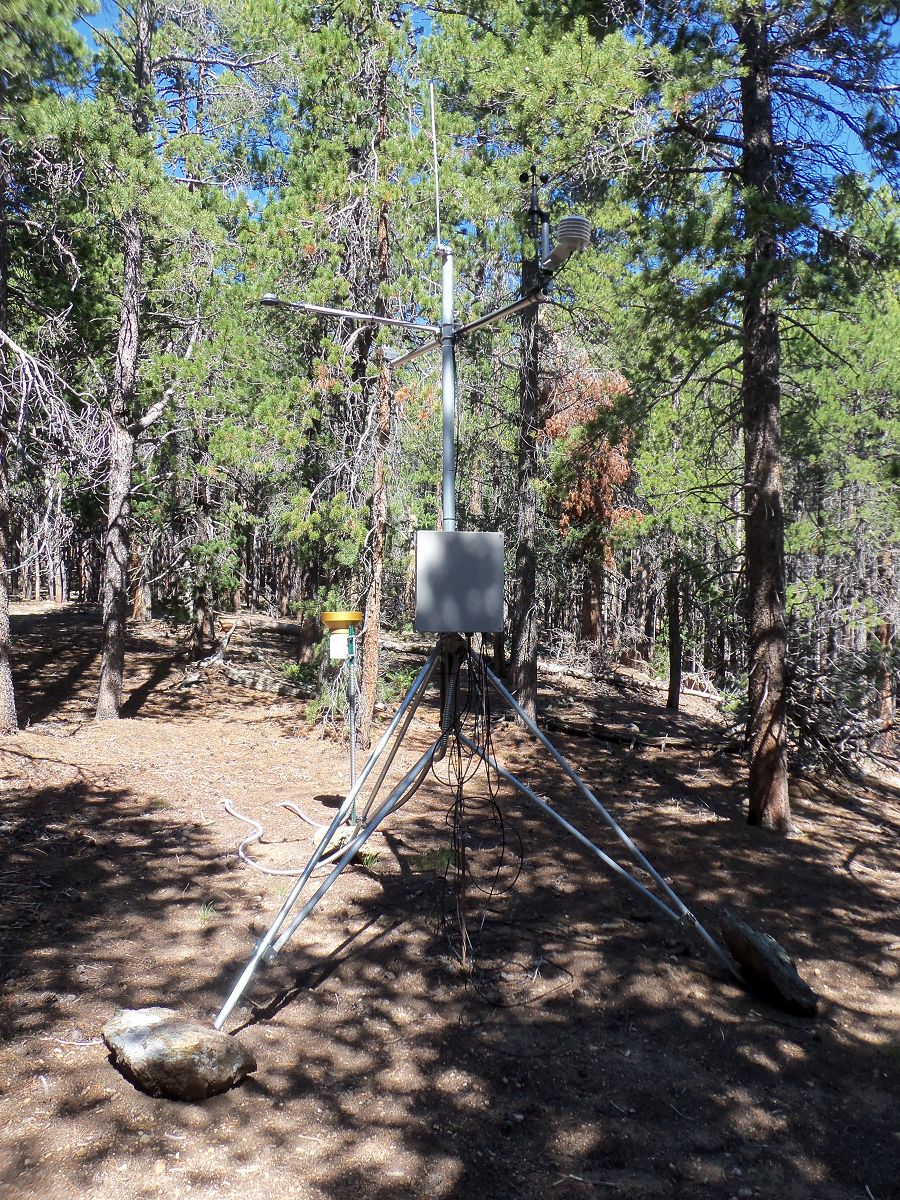
Fig. 3. Photo of the Gordon Gulch site meteorological station, which is 2.5 m above ground on this tripod (Photo credit Nate Rock).
Upstream and Downstream
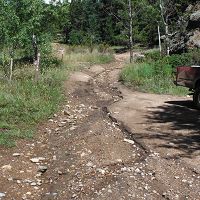
The rainfall was much greater in the lower part of the Boulder watershed than the upper watershed. It was therefore not surprising to hear that streams in the alpine area near the headwaters did not experience exceptional streamflow during or after this severe rainfall event (Nel Caine, pers. comm.), while the flow in lower Boulder Canyon was substantial enough to destroy the road and tear out the guard rail. In the City of Boulder, the creek crested its banks, destroying parts of the bike path and flooding areas adjacent to Boulder Creek. Discharge was measured at 5,000 cfs downstream of the City at 75th Street, although large quantities of water had been diverted and this represented only a part of the total discharge.
Graphs and Images of the Hydrologic Response in the CZO watersheds
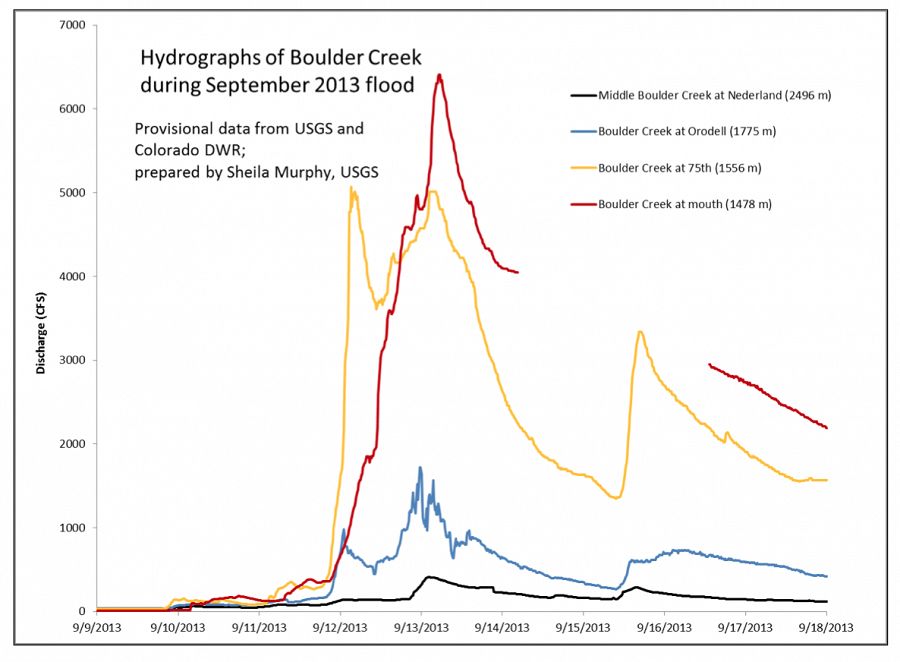
Fig. 4. Hydrographs of Boulder Creek during the September, 2013, rainfall and flood event. Provisional data is from the USGS and Colorado DWR, and were prepared by Sheila Murphy.

Fig. 5. Map showing locations of stream gauges along Boulder Creek, for which data is shown in Figure 4.

Fig. 6. Plot showing 10-minute precipitation and soil moisture content data during the precipitation event at the Gordon Gulch North-facing meteorological tripod (Hgt: 2.5 m). Between Sept. 9 - 19 (13:10 - 13:10 hrs), a total of 207.9mm (8 3/4") rain fell. The peak rainfall intensity measured was 16.3mm/hr on 9/11/2013 between 19:20 and 20:10 MST.

Fig. 7. Plot showing 10-minute precipitation and soil moisture content data during the storm event at the Betasso 10m meteorological tower. This tower is located adjacent to the Betasso water treatment plant at ~2,000m asl. Between Sept. 9 - 16, 2013 (13:20 - 13:20 hrs), total rainfall was 344.90 mm (~13.5"). The peak rainfall intensity was 36.3 mm/hr. on 9/11/2013 between 22:50 and 23:40 MST. The peak soil moisture at 15 cm depth was 25.9 % on 9/11/2013 at 23:40 hrs.
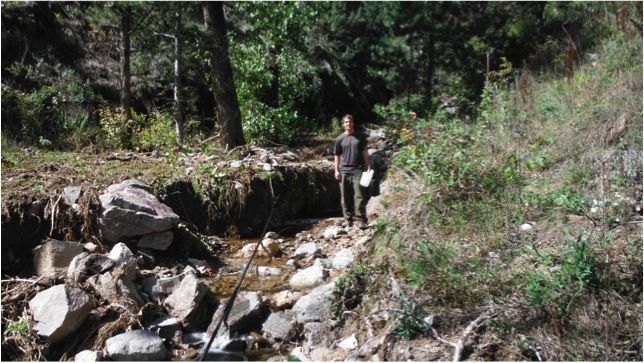
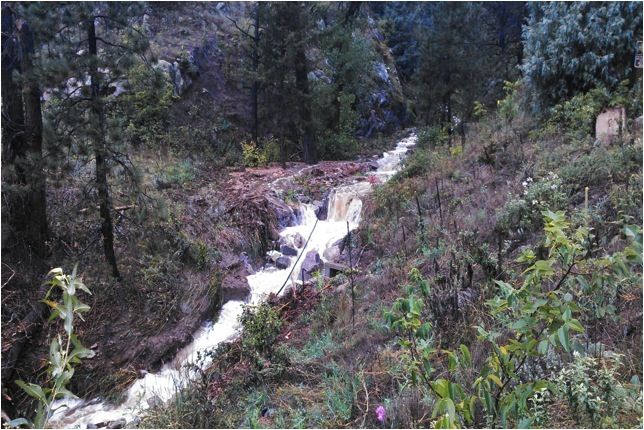
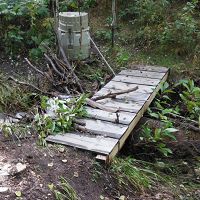
Fig. 8. Photo of the stream channel just below the Betasso surface water sampling site taken after the storm (Photo credit Nate Rock, 9/23/2013).
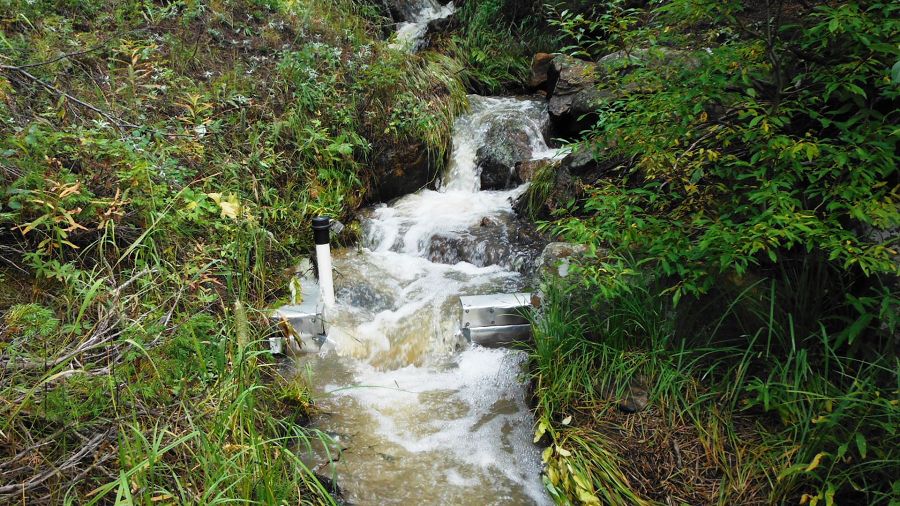
Fig. 9. Photo of the stream channel and gauge at the Gordon Gulch site.

Fig. 10. Gordon Gulch lower stream gauge barocompensated level and temperature data. The barocompensated level is the depth of the water column above the pressure transducer, and should only be used as a measure of flux of water level.
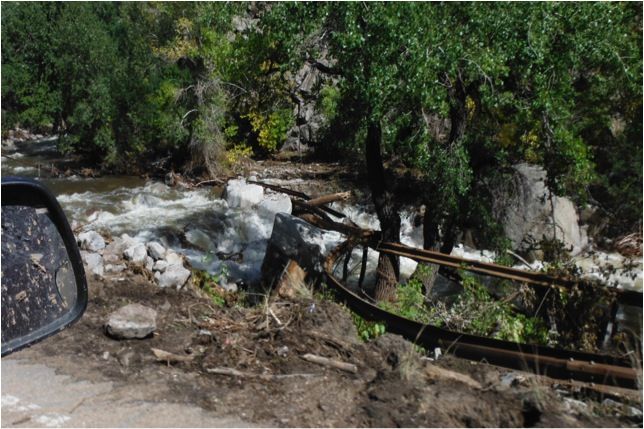
Fig. 11. Photo taken along lower Boulder Creek in Boulder Canyon. The guardrail was ripped out of ground and strung across the creek. Water from the streams in the Betasso watershed and Gordon Gulch drain into Boulder Creek upstream of this (Photo by Clayton Jensen, 9/23/2013).

Fig. 12. The drill rig at the Gordon Gulch site in Feb., 2011, drilling the borehole where groundwater levels are now measured (Photo credit Nate Rock).
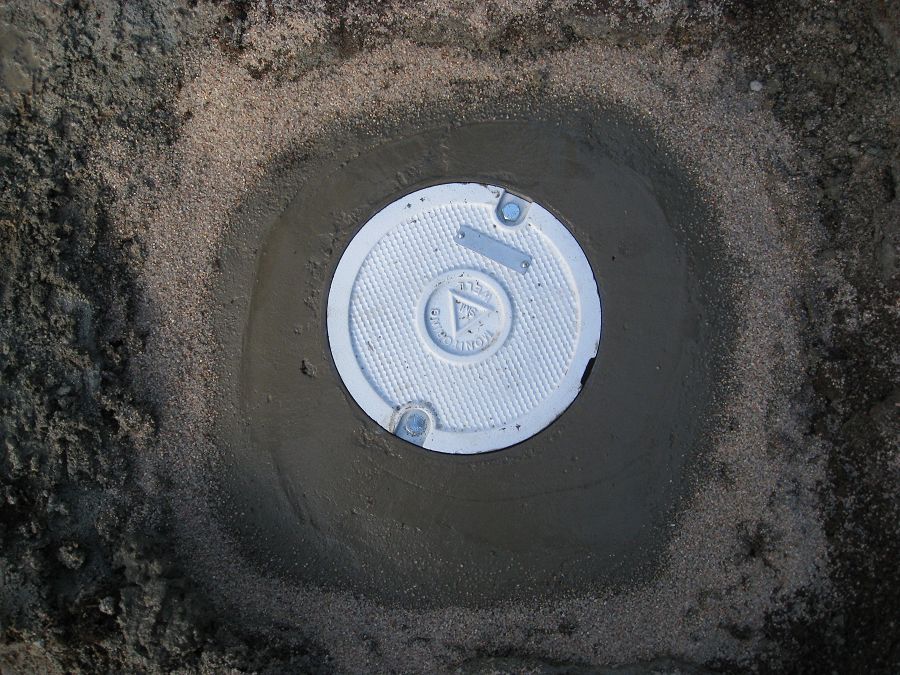
Fig. 13. Photo of the capped groundater well at the Betasso site (Photo credit Nate Rock).
Fig. 15. Plot showing 1- minute Betasso groundwater well (BT_GW_1) barocompensated level and temperature data. The barocompensated level is the depth of the water column above the pressure transducer, and should only be used as a measure of flux of water level. Data will eventually be converted to depth below ground surface. Note up until this time, we had not yet seen a response in this well, although that could be attributed to sampling interval and quantity. During this storm, the water level rose ~2.3m and was still climbing. It is the first time we have seen a significant response from this well. We were unable to sample for chemistry due to the park being closed. There was no temperature flux associated with increase in potentiometric surface of well.
Relevant Links
"Why Colorado Floods Were so Destructive." - NPR Article Oct. 8, 2013.
Boulder Creek Watershed Streamflow Monitoring Sites - Look up data for Boulder Creek near Orodell, and near 75th St. Data provided by the City of Boulder and the USGS.
Boulder Creek Flow Rates - City of Boulder web page outlining different types of rates.
State of the Watershed: Water Quality of Boulder Creek, Colorado - USGS Survey Circular 1284 by Sheila Murphy.
What is groundwater? The USGS Groundwater page - A terrific resource with the basics about groundwater, data, and research articles.
Boulder Canyon reopens after flood repairs - A news story from Oct. 6, 2013.
Fig. 2. The Boulder Creek CZO lies within the Boulder Creek watershed (1160 sq km), which drains the Front Range from the Continental Divide (4120 m) to the eastern Plains (1480 m). Our work concentrates on three research sites that span a wide range of elevation, climate, geologic history, and weathering regimes: Green Lakes Valley (3567-3745 m, 2.3 sq km), Gordon Gulch (2446-2737 m, 2.75 sq km), and Betasso (1810-2024 m, 0.45 sq km).
Fig. 1. Seven-day rainfall totals over Colorado, ending Sept. 13, 2013 (Image courtesy of the NOAA National Weather Service). Note that totals over the Boulder area exceeded 17 inches of rain in one week.
Fig. 3. Photo of the Gordon Gulch site meteorological station, which is 2.5 m above ground on this tripod (Photo credit Nate Rock).
Fig. 4. Hydrographs of Boulder Creek during the September, 2013, rainfall and flood event. Provisional data is from the USGS and Colorado DWR, and were prepared by Sheila Murphy.
Fig. 5. Map showing locations of stream gauges along Boulder Creek, for which data is shown in Figure 4.
Fig. 6. Plot showing 10-minute precipitation and soil moisture content data during the precipitation event at the Gordon Gulch North-facing meteorological tripod (Hgt: 2.5 m). Between Sept. 9 - 19 (13:10 - 13:10 hrs), a total of 207.9mm (8 3/4") rain fell. The peak rainfall intensity measured was 16.3mm/hr on 9/11/2013 between 19:20 and 20:10 MST.
Fig. 7. Plot showing 10-minute precipitation and soil moisture content data during the storm event at the Betasso 10m meteorological tower. This tower is located adjacent to the Betasso water treatment plant at ~2,000m asl. Between Sept. 9 - 16, 2013 (13:20 - 13:20 hrs), total rainfall was 344.90 mm (~13.5"). The peak rainfall intensity was 36.3 mm/hr. on 9/11/2013 between 22:50 and 23:40 MST. The peak soil moisture at 15 cm depth was 25.9 % on 9/11/2013 at 23:40 hrs.
Fig. 8. Photo of the stream channel just below the Betasso surface water sampling site taken after the storm (Photo credit Nate Rock, 9/23/2013).
Fig. 9. Photo of the stream channel and gauge at the Gordon Gulch site.
Fig. 10. Gordon Gulch lower stream gauge barocompensated level and temperature data. The barocompensated level is the depth of the water column above the pressure transducer, and should only be used as a measure of flux of water level.
Fig. 11. Photo taken along lower Boulder Creek in Boulder Canyon. The guardrail was ripped out of ground and strung across the creek. Water from the streams in the Betasso watershed and Gordon Gulch drain into Boulder Creek upstream of this (Photo by Clayton Jensen, 9/23/2013).
Fig. 12. The drill rig at the Gordon Gulch site in Feb., 2011, drilling the borehole where groundwater levels are now measured (Photo credit Nate Rock).
Fig. 13. Photo of the capped groundater well at the Betasso site (Photo credit Nate Rock).
Fig. 14. Plot showing 10-minute Gordon Gulch groundwater levels (depth below ground surface to water) and temperature data at well number 6. This well experienced ~1 m more of water level increase in response to this event compared to snowmelt earlier this year. Water level rose by more than 4 m!
Fig. 15. Plot showing 1- minute Betasso groundwater well (BT_GW_1) barocompensated level and temperature data. The barocompensated level is the depth of the water column above the pressure transducer, and should only be used as a measure of flux of water level. Data will eventually be converted to depth below ground surface. Note up until this time, we had not yet seen a response in this well, although that could be attributed to sampling interval and quantity. During this storm, the water level rose ~2.3m and was still climbing. It is the first time we have seen a significant response from this well. We were unable to sample for chemistry due to the park being closed. There was no temperature flux associated with increase in potentiometric surface of well.
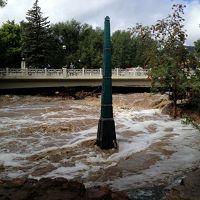
Fig. 15. Photo taken downstream of where Boulder Creek leaves the canyon and enters the downtown area, near the public library, on 9/15/2013. The creek has crested its banks and the area is still flooded a few days after the rain. (Photo credit: Val Sloan).
News Category:
RESEARCH |
EDUCATION/OUTREACH
People Involved
CZO
-
Boulder, STAFF
-

Boulder, INVESTIGATOR
-
Boulder, STAFF
-

Boulder, STAFF
-
Boulder, GRAD STUDENT
-

Boulder, STAFF
-

Boulder, UNDERGRAD
-

Boulder, STAFF
-

Boulder, UNDERGRAD
-

Boulder, INVESTIGATOR
Discipline Tags and CZOs
Hydrology
Geomorphology
Climatology / Meteorology
Soil Science / Pedology
Boulder
Related News
Fresh landslides triggered during September’s deluge
03 Oct 2013 - Heavy Rainfall and the Geomorphic Response During the week of September 9th, 2013, several days of continuous rainfall caused widespread...
Colorado’s Extreme Weather Event Smashes Records
26 Sep 2013 - Colorado rainfall records going back to 1893 were shattered by September's intense and persistent rainstorm.
Boulder Creek CZO assessing flood in Upper Gordon Gulch
18 Sep 2013 - Assessing Gordon Gulch continues
Boulder Creek CZO assessing flood in Lower Gordon Gulch
18 Sep 2013 - BcCZOII member, Nate Rock, was able to access Lower Gordon Gulch via Golden Gate on 17 September 2013 only to find that the GGL gauge had been...
Boulder Creek CZO responds to record-breaking Colorado rainfall and flooding
13 Sep 2013 - Investigators and staff rush into action to collect samples and observe impacts
Explore Further
