Colorado’s Extreme Weather Event Smashes Records

Extreme Weather in the Colorado Front Range
An extraordinary Colorado rainstorm in September of 2013 has been the focus of much discussion amongst the many atmospheric and Earth scientists in the region. What makes this weather event exceptional is the duration at a relatively high the rain. The impact of this downpour on the region was exacerbated by rain falling on steep, impermeable terrain and funneling down canyons into the flat Plains.
Rainfall data has been collected for 120 years in Boulder, since 1893. These are the records that were broken:
- 1-day all-time record: 9.08” (231 mm) - nearly double that of the previous wettest day: 4.8" (122 mm) on July 31, 1919)
- 2-day all-time record: 11.52" (295 mm)
- 7-day all-time record: 16.9" (429 mm)
- Five of those 7 days set daily rainfall records
- One-month record 17.18 inches, most of of which fell during the past week (previous all-time monthly record: 9.59" in May of 1995)
- Wettest September on record (previousl wettest September: 5.5” (140 mm) in 1940)
- One-year record has been broken (previous wettest year: 29.93” (760 mm) in 1995)
Other interesting observations:
- Most of the rain fell in 36 hours, from the afternoon of September 11th until the early morning of September 13th.
- By contrast, the July 1976 Big Thompson and July 1997 Fort Collins flood events were more thunderstorm-driven events with much smaller footprints, shorter durations, and higher peak rates of rainfall.
- This was a rare precipitation event, especially for September.
- Multi-day rainfall events in the past had similar spatial extents. These included events in Sept. 1938 - 10” max (254 mm), June 1965 - 16” max (406 mm), and May 1969 - 14” max (356 mm). The footprint of the 1938 event was most similar to that of 2013.
- It has been reported that this was a “1000-year rainfall” (or had a 1/1000 chance of happening in any given year) for the Boulder area based on the NOAA Atlas 14 precipitation frequency analysis; however, this analysis extrapolates from the historical record using statistical assumptions that have large uncertainties for very rare events.
These points above are highlights from the Preliminary Assessment by CIRES Western Water Assessment / NOAA ESRL / CSU CCC (3 Mb PDF).
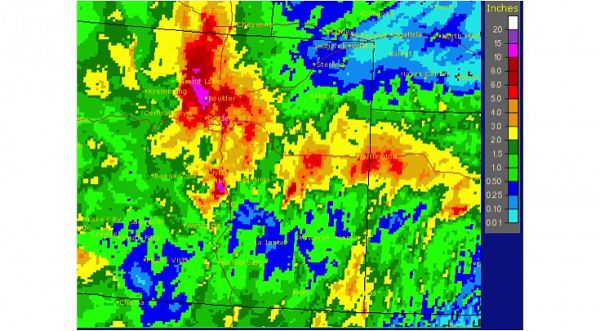
Seven-day rainfall totals over Colorado, ending Sept. 13, 2013 (image courtesy of the NOAA National Weather Service). Note that totals over the Boulder area exceeded 15 inches of rain in one week.
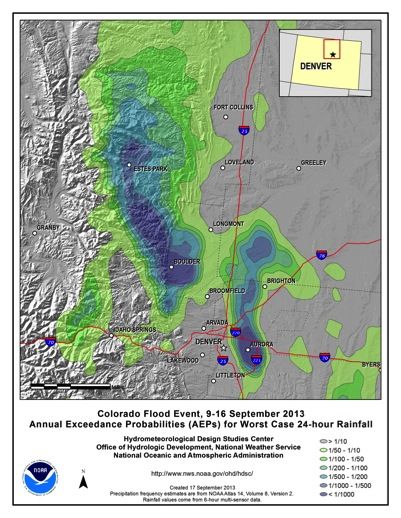
A map showing the probabilities that the amount of rainfall received were expected. For example, over the Boulder area, the amount of rainfall in certain areas had a 1/500 to 1/1000 chance of occurring in any given year. (Image courtesy of the NOAA National Weather Service).
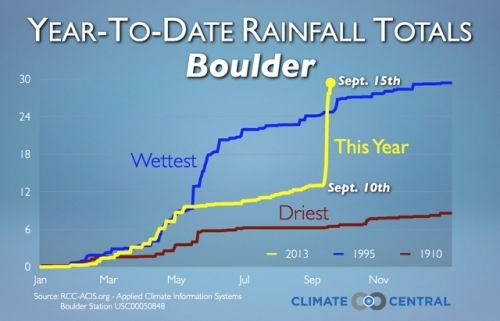
In five days, Boulder went from having one of its driest year on record to having its wettest year on record. (Image courtesy Climate Central, credit: Dennis Adams-Smith)
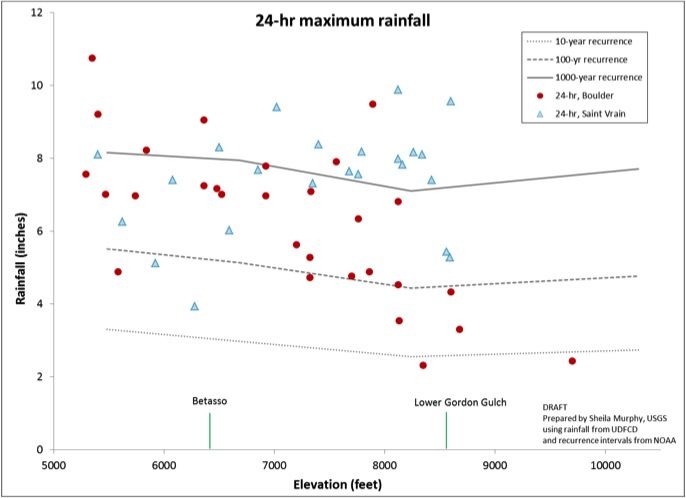
24-hour maximum rainfall for this event in the Boulder and St. Vrain watersheds at different elevations. The lines represent the probability of 24-hour totals being reached once in 10, 100, and 1000 years. Note that the 24-hour rainfall totals exceed the 1000-recurrence interval in the lower Boulder watershed and in the upper St. Vrain watershed (again, as noted above, these lines are extrapolated from the historical record, and have large uncertainties for very large events). This corresponds with the pattern of precipitation shown in the maps above. (Image courtesy of Sheila Murphy, USGS)

A 3-D view diagram that shows the area that was mapped as the zone that would be flooded by a 1/500 probability per year event. Note that flooding was exacerbated by having a high-relief, low-permability landscape that funneled rain waterdown canyons and out onto the Plains. (Image courtesy of floodsafety.com)
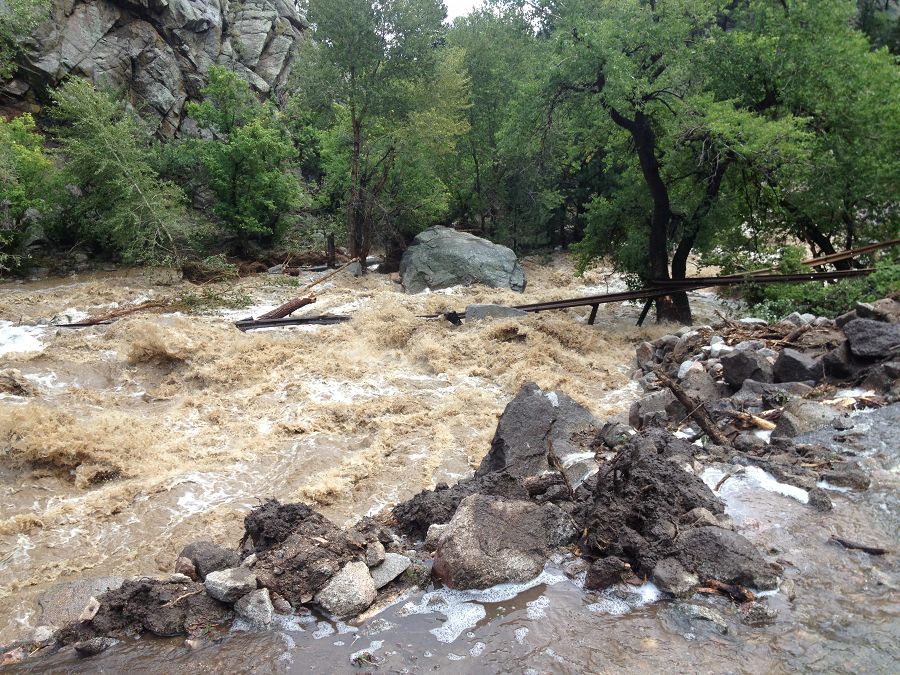
Boulder Creek in Boulder Canyon near the Elephant Buttress, about half a mile up the canyon, taken at 12:50 pm on Friday, Sept. 13, 2013, by Bruce Vaughn. The road was taken out by the flooding river; notice the guard rail that has been displaced by the water.
Relevant Links
Climate Central article on Colorado's storm setting rainfall records
NBC News Science article: Colorado disaster: What is a 100-year flood? It's not what you think
View the Preliminary Assessment by CIRES Western Water Assessment / NOAA ESRL / CSU CCC (3 Mb PDF).
Seven-day rainfall totals over Colorado, ending Sept. 13, 2013 (image courtesy of the NOAA National Weather Service). Note that totals over the Boulder area exceeded 15 inches of rain in one week.
A map showing the probabilities that the amount of rainfall received were expected. For example, over the Boulder area, the amount of rainfall in certain areas had a 1/500 to 1/1000 chance of occurring in any given year. (Image courtesy of the NOAA National Weather Service).
Rainfall totals for each month in the Boulder watershed as recorded since the late 1800s. The total for the first half of September, 2013, far exceeds the total for any other month on record.
In five days, Boulder went from having one of its driest year on record to having its wettest year on record. (Image courtesy Climate Central, credit: Dennis Adams-Smith)
24-hour maximum rainfall for this event in the Boulder and St. Vrain watersheds at different elevations. The lines represent the probability of 24-hour totals being reached once in 10, 100, and 1000 years. Note that the 24-hour rainfall totals exceed the 1000-recurrence interval in the lower Boulder watershed and in the upper St. Vrain watershed (again, as noted above, these lines are extrapolated from the historical record, and have large uncertainties for very large events). This corresponds with the pattern of precipitation shown in the maps above. (Image courtesy of Sheila Murphy, USGS)
A 3-D view diagram that shows the area that was mapped as the zone that would be flooded by a 1/500 probability per year event. Note that flooding was exacerbated by having a high-relief, low-permability landscape that funneled rain waterdown canyons and out onto the Plains. (Image courtesy of floodsafety.com)
Boulder Creek in Boulder Canyon near the Elephant Buttress, about half a mile up the canyon, taken at 12:50 pm on Friday, Sept. 13, 2013, by Bruce Vaughn. The road was taken out by the flooding river; notice the guard rail that has been displaced by the water.
News Category:
RESEARCH
Related News
Explore Further
