GIS, Remote Sensing & Geophysics
The BcCZO has developed many tools for GIS
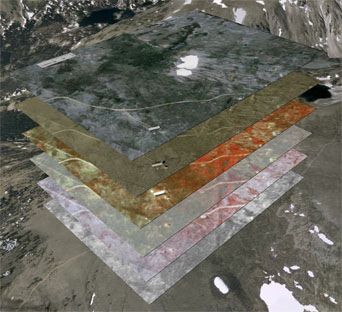
BcCZO’s GIS data is an essential component to the BcCZO’s mission and research. The BcCZO has developed many products (e.g., maps, graphs, charts, and geo-databases) for the BcCZO to distribute geospatial and geographical data via its website and in print to scientific communities, other CZOs, and the general public. We have implemented GIS standards and developed a central GIS data distribution system. BcCZO GIS specialist also allows for a public interface for the BcCZO regarding GIS issues and queries. All map layers share a common projection and datum (UTM zone 13, NAD83)
GIS highlights
-
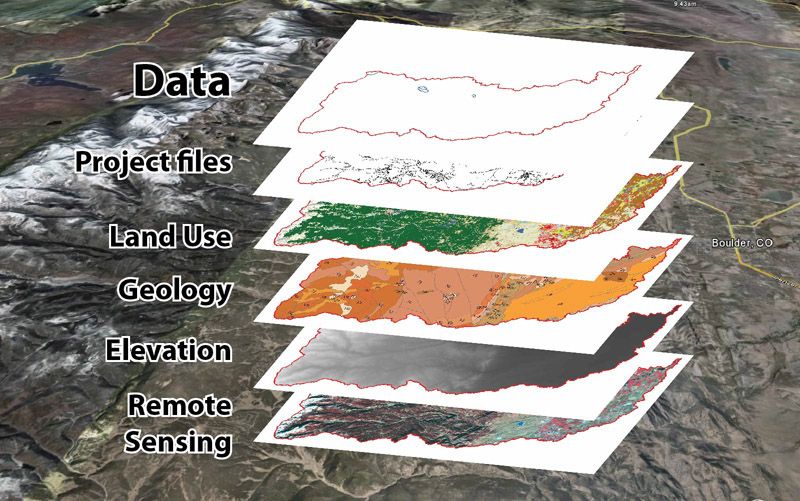
ArcGIS map projects with aerial photography, site extents, and framework data for download from the website as well as specialized geospatial products and individual layers for download within ArcGIS and kml file formats.
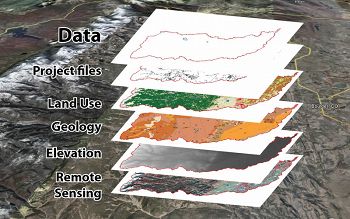
GIS layers an integral part of the BcCZO
- Google-Maps interactive web application to view and download BcCZO data. This interactive display highlights BcCZO research, including various layers of data (e.g., lakes and streams, glaciers, geological details). Within this Google-Earth application. (
- Google-Maps application to show the shallow seismic refraction geophysical data collected within BcCZO.
- ArcGIS modeling tools to create an interpretive visualization of snow depth surveys for the 2008-2009 season and other products for interpretation by BcCZO investigators.
- We also create maps and figures as requested by BcCZO scientists and student researchers for publications and presentations.
For a comprehensive GIS overview of BCCZO and its sampling sites, please go to
COMING SOON
This GIS page includes a Google Eartch tour of BCCZO, LIDAR imageries, and historic images.
Remote Sensing:
High-resolution Orthoimagery and LiDAR are available for the BcCZO area.
2010 Boulder Creek, Colorado Snow-Off and Snow-On LiDAR Surveys.
- Snow off: Total area imaged is 598.92 km^2
- Flight dates are 8/16/2010 - 8/26/2010.
- Snow on: Total area imaged is 336.1 km^2
- Flight dates are 5/5/2010, 5/9/2010 and 5/20/2010-5/21/2010.
* Due to weather and equipment failures the Snow-On surveys were flown during 2 different time periods in May, between which there were substantial snow accumulations.
Lidar Data Collection.
This data was collected in collaboration between the National Center for Airborne Laser Mapping (NCALM) project and the Boulder Creek Critical Zone Observatory (CZO), both funded by the National Science Foundation (NSF). The dataset contains 1 m Digital Surface Models (first-stop), Digital Terrain Models (bare-earth), and 10 points/m2 LAS-formated point cloud tiles. The DSMs and DTMs are available in GeoTIFF format. The Digital Terrain Model (DTM) is a ground-surface elevation dataset better suited for derived layers such as slope angle, aspect, and contours. Together, the LiDAR Digital Elevation Models (DEM) and point cloud data will be of interest to land managers, scientists, and others for study of topography, snow, ecosystems and environmental change.
The Boulder Creek CZO will be using the LiDAR data to further their mission of focusing on how water, atmosphere, ecosystems, & soils interact and shape the Earth's surface. The "Critical Zone" lies between rock and sky. It is essential to life - including human food production - and helps drive Earth's carbon cycle, climate change, stream runoff, and water quality.
See the Read Me for more http://czo.colorado.edu/geGIS/0README_BcCZO_LiDAR.pdf
Ortho-Imagery
We also have a large Orthophoto coverage of Boulder Creek CZO basin beginning at the Flat Irons with 2008 DRAPP (Denver Regional Aerial Photography Project) imagery — including IR at 30 cm resolution. For focus sites It is available on our website. For Green Lakes Valley area in partnership with the Niwot LTER we have access to ten orthophotography mosaics that span seven decades from several sources — from 1938 to 2008 — at 1.0 m to 30 cm resolution.
Usage
This data release will be useful for a variety of environmental research, including time-series analysis of climate-related changes in vegetation, hydrology, geomorphology, etc. The datasets should also be useful for visualization, mapping, modeling, and other objectives tied to science planning, land management, research, education, and outreach.
Geophysics:
A key to studying the critical zone is to avoid significantly altering the active processes in the attempt to quantify or understand them. Capturing the present architecture of the critical zone without upsetting the system therefore becomes a challenge where riverbanks, road cuts, and cliffs fail to provide sufficient exposure to integrate the critical zone across the landscape.
Shallow geophysical techniques offer an excellent toolset for obtaining spatially extensive data of subsurface physical properties with little environmental turbulence of the critical zone. Particularly shallow seismic refraction (SSR), electrical resistivity tomography (ERT), electromagnetic (EM) induction and ground-penetrating radar (GPR) comprise a suite of techniques with individual strengths that build upon results from the other methods when focused towards understanding critical zone structure in the Boulder Creek watershed.
For Shallow Seismic Refraction and Electrical Resistivity study of the Betasso, Gordon Gulch and Green Lakes Valley conducted by Kevin Befus and Matthias Leopold respectively, go to BcCZo data
GIS layers an integral part of the BcCZO
Image showing 3-D profile views of shallow geophysical lines collected in the Betasso catchment
Explore Further
