GIS, Remote Sensing & Geophysics
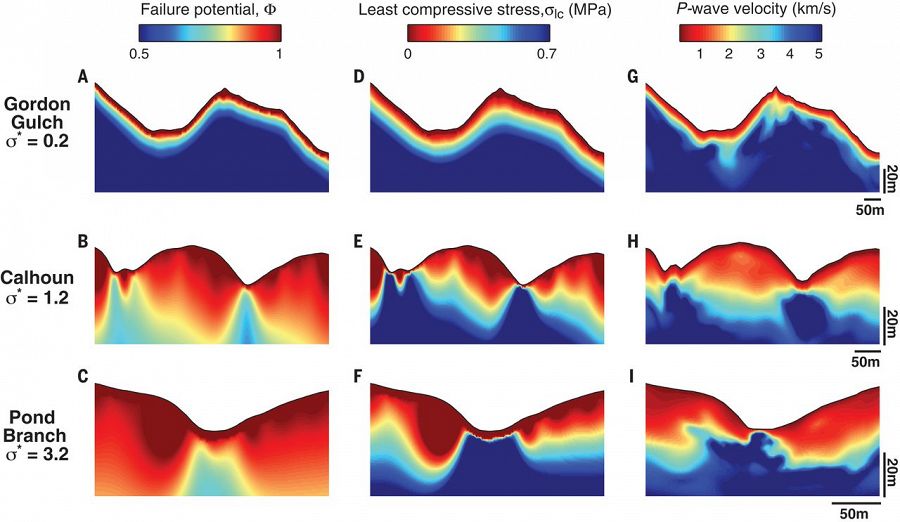
Comparisons of topographic stress and seismic velocity. Modeled failure potential (A to C), modeled magnitude of the least compressive stress (D to F), and measured P-wave velocity (G to I) for Gordon Gulch [(A), (D), and (G)], Calhoun [(B), (E), and (H)], and Pond Branch [(C), (F), and (I)]. Transect locations are marked in white in Fig. 2. The topographic surface was smoothed for stress calculations. Vertical exaggerations are 3.6× at Gordon Gulch, 3.7× at Calhoun, and 2.3× at Pond Branch.
In late July and early August of 2014, a LiDAR flight was flown by NCALM with hyperspectral instrumentation to observe aboveground vegetation. On 26 February 2016, with tree canopies lacking most of their foliage, we had a second LiDAR flight for high resolution DEM. The full LiDAR datasets are publicly available. To download them, see Calhoun CZO 2014 Leaf-On Hyperspectral and LiDAR Survey and Calhoun CZO 2016 Leaf-Off LiDAR Survey.
In April 2014, in collaboration with the Wyoming Center for Geophysics and Hydrology, we used Seismic Refraction (SSR), Ground Penetrating Radar (GPR), and Electrical Resistivity(ER) to visualize subsurface physical properties, including depth to the water table, thickness of weathered material, and depth to fresh bedrock. We characterized the subsurface of the interfluve surrounding our 70-m deep 15-cm dia groundwater well (30-m soil and regolith, 40 granite), and two of the experimental watersheds (W3 and W4). Results were published in Science - see St. Clair et al. (2015), Geophysical imaging reveals topographic stress control of bedrock weathering.
Explore Further
