Learning exercise: How African dust feeds the Puerto Rico ecosystem
10 Jun 2015
News Source: CZO National Office
CZO and AGI distribute a hands-on learning exercise on the "Connectivity of Global Ecosystems: The Influence of Dry Deserts on Tropical Rain Forests"
The CZOs have been cooperating with the American Geosciences Institute (AGI) since 2013 to create hands-on learning exercises using CZO data for use in secondary education classrooms. The one-page, double-sided exercises have been included in AGI's Earth Sciences Week packets and sent to 16,000 teachers nationwide.
For 2015's AGI Earth Sciences Week, a new exercise has been created by members and affiliates of the Luquillo CZO. Adam Wymore (Univ. of New Hampshire), Nick Guy (Univ. of Wyoming), and William McDowell (Univ. of New Hampshire) have assembled three documents:
• The Influence of Dry Deserts on Tropical Rain Forests (1 MB pdf)
• African Dust Supplementary (2 MB pdf)
• Rain chemistry data AGI (0.5 MB xlsx)
Additional hands-on exercises are available at the National Education and Outreach K-12 page.
HANDS-ON LEARNING EXERCISE
Connectivity of Global Ecosystems: The Influence of Dry Deserts on Tropical Rain Forests
The Earth's Critical Zone and its global ecosystems are connected in a multitude of ways, sometimes surprising. In this exercise, we will investigate how dust and nutrients from north African deserts can be blown westward across the Atlantic Ocean and deposited in the rainforests of Puerto Rico.
Prepared by:
Adam Wymore (Univ. of New Hampshire)
Nick Guy (Univ. of Wyoming)
William McDowell (Univ. of New Hampshire)
The Critical Zone
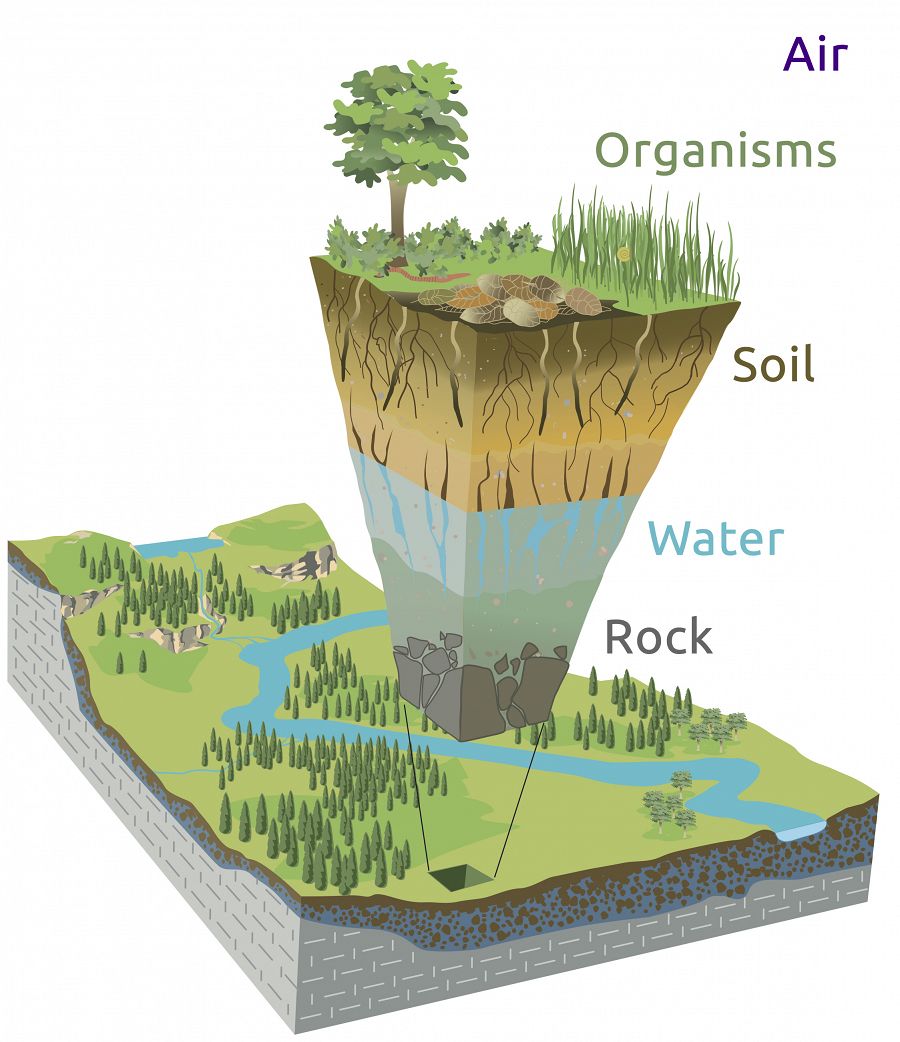
The Earth’s Critical Zone (CZ) is defined as the surface of Earth extending from the boundary between the vegetation and atmosphere, down through the soil, and to belowground depths where groundwater and bedrock interact. The CZ is where terrestrial life, including humanity, resides. The CZ provides many of the resources organisms need including fresh water, sustainable soils and a balanced atmosphere.
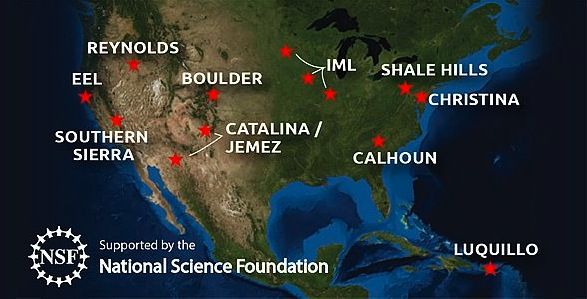
Critical Zone science is an emerging field of Earth Science seeking to integrate across multiple scientific disciplines to study how the CZ supports life and how the CZ responds to change. Ten Critical Zone Observatories (CZOs) have been established in the United States to support integrative research of CZ processes (criticalzone.org). CZ science requires large-scale systems thinking to understand all of the factors that influence the CZ.
One such example of the connectivity of Earth’s Critical Zone is dust and nutrient inputs that originate from the Saharan and Sahel Deserts on the African continent and are deposited in neotropical rain forests via precipitation events in the Luquillo Mountains of Puerto Rico and the Luquillo CZO
Learn more about the Critical Zone
National Science Standards & Objectives
This activity meets a key National Science Standard:
HS-ESS2-2: Analyze geoscience data to make the claim that one change to Earth’s surface can create feedbacks that cause changes to other Earth systems.
Use this activity as part of the Life Science unit on Interdependent Relationships in Ecosystems or the Earth and Space Science unit on Weather and Climate. Students should be familiar with concepts of convective systems, trade winds, nutrient cycling and ecosystems.
The objectives of this activity are to demonstrate that
(1) Earth’s ecosystems and Critical Zone are inextricably linked via feedback processes.
(2) Nutrients that feed ecosystems can be derived from outside the system.
We encourage instructors to use their creativity to modify and adapt this activity to meet their needs.
Timing: Parts I-II: 60-90 min.
How African dust feeds the Puerto Rico ecosystem
Part I: African Dust Storms
The Saharan and Sahel regions of North and West Africa have an arid climate with little plant growth. The desert heat creates rising air motions, leading to a large, strong surface low pressure system (Saharan Heat Low; SHL). As boreal spring transitions to summer at northern latitudes, moisture from the Gulf of Guinea penetrates into the Sahel, driving the formation of the West African Monsoon (WAM). Typically, temperatures decrease from the tropics pole-ward; however, during this time there is a reversal in this archetype leading to easterly winds through much of the atmosphere (African Easterly Jet; AEJ). The dry (northern; black dashed lines) and moist (southern; white dashed lines) air masses form a strong atmospheric frontal boundary across the Sahel which spur large thunderstorm development (~80% of Sahelian annual rainfall occurs June-September).

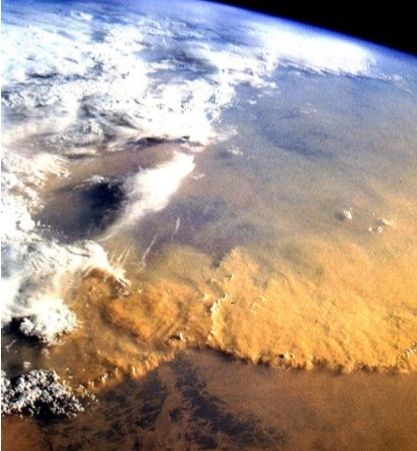
Dust storms are common during the WAM. These dust storms are produced by large near-surface winds generated by low level jets associated with the SHL, local orography, large scale weather systems intruding from the north and regional thunderstorms. Each phenomenon lofts dust particles high in the atmosphere for efficient long range transport via the AEJ. This dust-laden air mass is known as the Saharan Air Layer (SAL)
Airborne dust particles contain essential elements (e.g. calcium) derived from the Earth’s crust which fertilize neotropical rain forests.
A massive sandstorm blowing off the northwest African desert has blanketed hundreds of thousands of square miles of the eastern Atlantic Ocean with a dense cloud of Saharan sand. NASA SeaWiFS image acquired February 26, 2000.
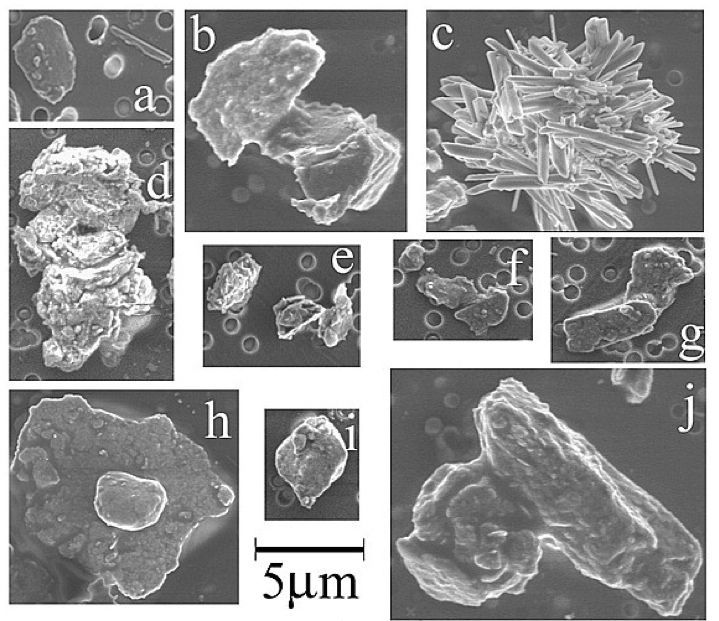
Detailed electron micrographs of individual dust particles common to the Saharan Air Layer and that arrive in Puerto Rico. Reid et al 2003. doi:10.1029/2002JD002935
Supplementary Images
Extension idea: Have students discuss how the Mars image supports the hypothesis that Mars did/does/could support life.
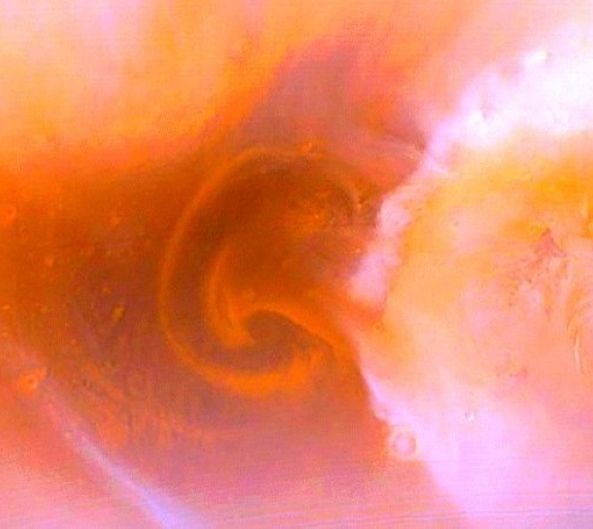
Dust storm on mars. Notice the formation of the dust-jet similar to the African Easterly Jet (AEJ) from the African continent. Image Credit

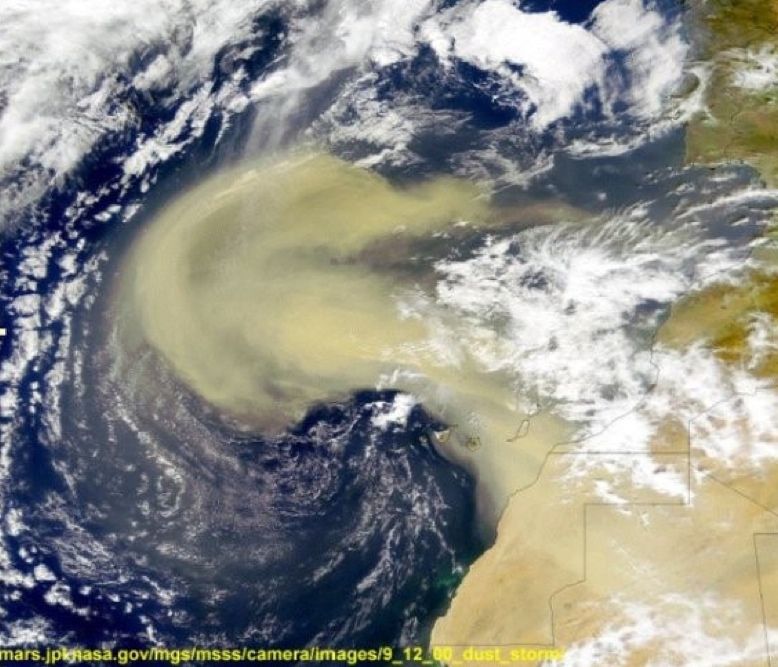
Satellite image of dust storm moving west across Africa. Dust front is moving towards lower right hand corner of image. Image Credit.
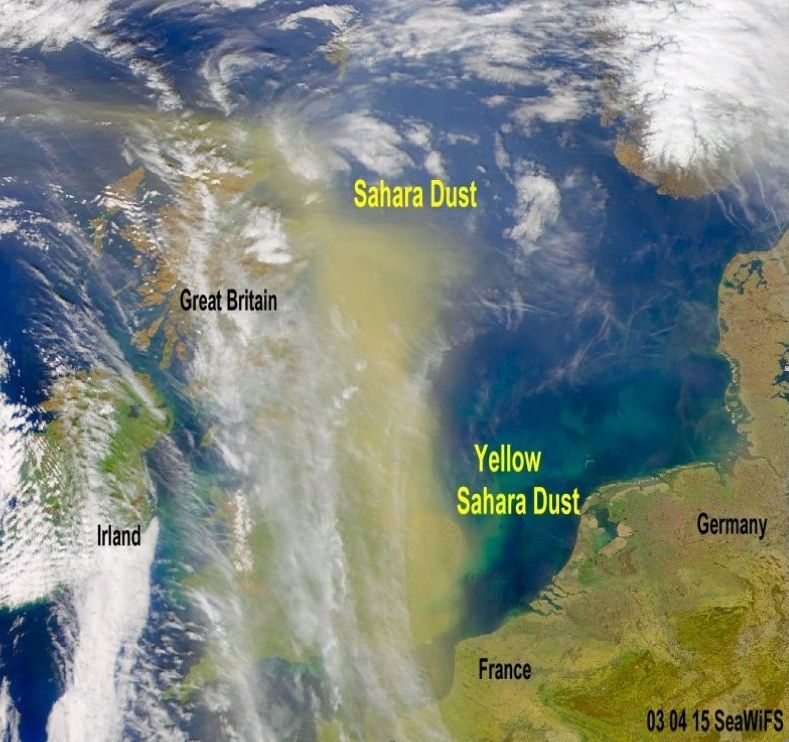
Saharan dust arriving over the United Kingdom. March, 2003. Image Credit
NASA | Satellite Tracks Saharan Dust to Amazon in 3-D (2:14)
This 2 minute video produced by NASA uses LIDAR technology to show the movement of the Saharan Air Layer (SAL). It contrasts from the activity in that it emphasiizes the essential element phosphorous and its deposition into the Amazon Basin. However, the take-home points are identical to the calcium and Puerto Rico story from the AGI activity.
It is important to note that tropical ecosystems like the Amazon basin often lose critical nutrients due to hydrological processes and run-off. Thus inputs like these that enter via the SAL are essential to replenishing the lost stocks of nutrients.
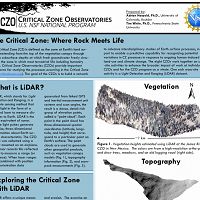
Light Detection and Ranging (LIDAR) is a type of remote sensing and satellite technology that uses light to make high-resolution maps of Earth. LIDAR is the light equivalent of sonar.
Please see another Critical Zone AGI activity based on using LIDAR technology within Critical Zone Observatories.
Part II: Dust and nutrient inputs into tropical rain forests.
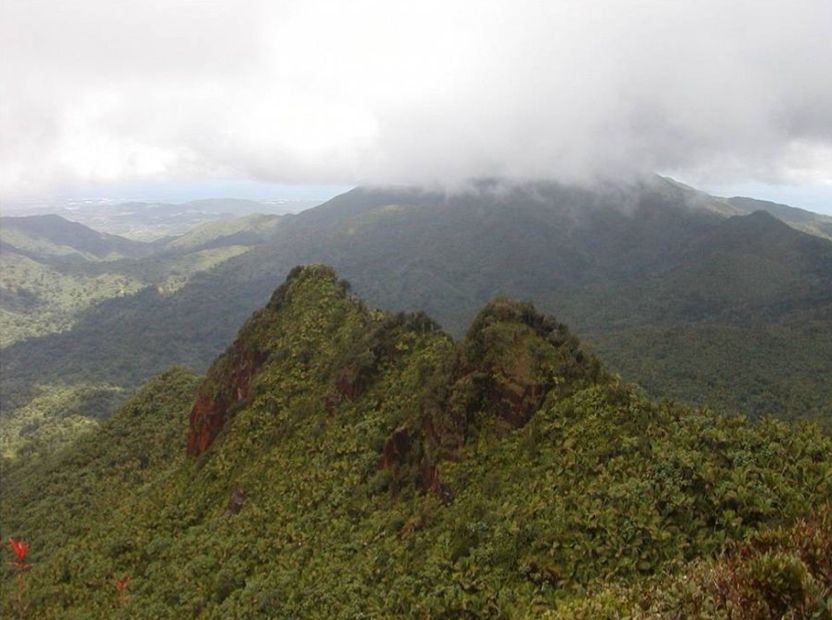
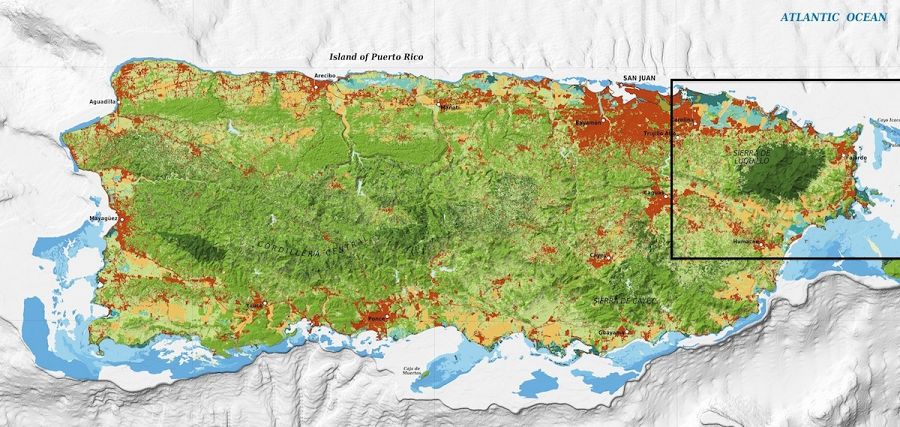
The Luquillo Mountains, Puerto Rico. More info
As the SAL moves across the Atlantic and into the Caribbean, elements derived from dust storms in North and West Africa are deposited into tropical island ecosystems. One major site of deposition is the Luquillo Mountains of Puerto Rico. The Luquillo Mountains are home to one of the ten CZOs. The Luquillo CZO in particular provides a unique setting to quantify the dust and nutrients that arrive in the neotropics due to the SAL.
The Luquillo Mountains extend upwards on the NE corner of Puerto Rico (E) with peak elevations of approximately 1050 meters. This creates a precipitation gradient which increases with elevation (F). Precipitation events promote the deposition of Saharan and Sahelian dust and crustal elements including calcium which is essential for soil fertility.
Puerto Rico ecosystems. Wikipedia.
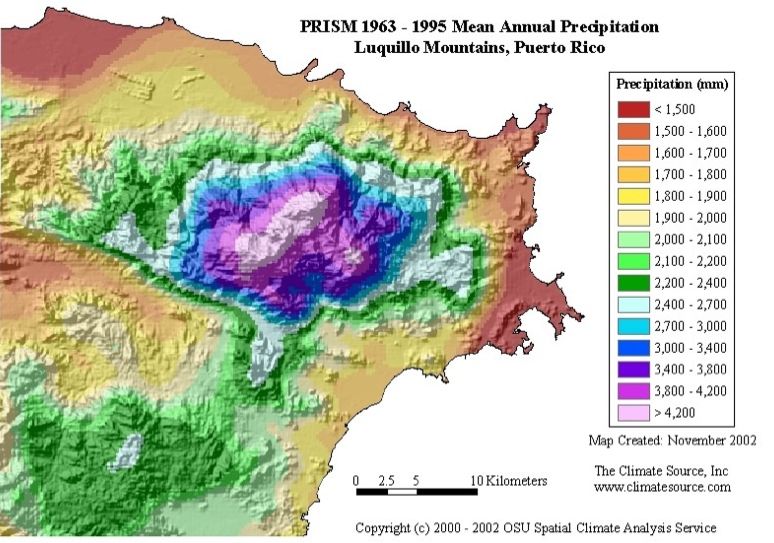
Mean Annual Precipitation, Luquillo Mountains, Puerto Rico. Climate Source Inc.
Season patterns in rainwater chemistry
In the below portion of the Part II activity, students will download rainwater chemistry data and look for seasonal patterns of calcium inputs. Students will then interpret how precipitation-derived calcium compares with seasonal patterns of the SAL and seasonal dust inputs. Students should work to interpret the data to show the connectivity of meteorological process in North and West Africa and nutrient inputs into tropical rainforest.
Materials needed:
- Overhead projector for viewing slides contained within supplementary information
- Working knowledge of Excel.
Directions for activity:
1. Download the excel worksheet: Rain_chemistry_data_AGI (0.5 MB xlsx)
2. Read information on “Instructions” tab of worksheet.
3. Have students determine monthly averages for rainwater chemistry.
4. Have students build graphs to compare the different sites and depositional processes
Part III. Activity extension
Timing: Various length depending on scope of projects.
1) Students generate hypotheses for how changes in Saharan and Sahelian precipitation influence dust export to the Caribbean (G: See Supplementary Material)
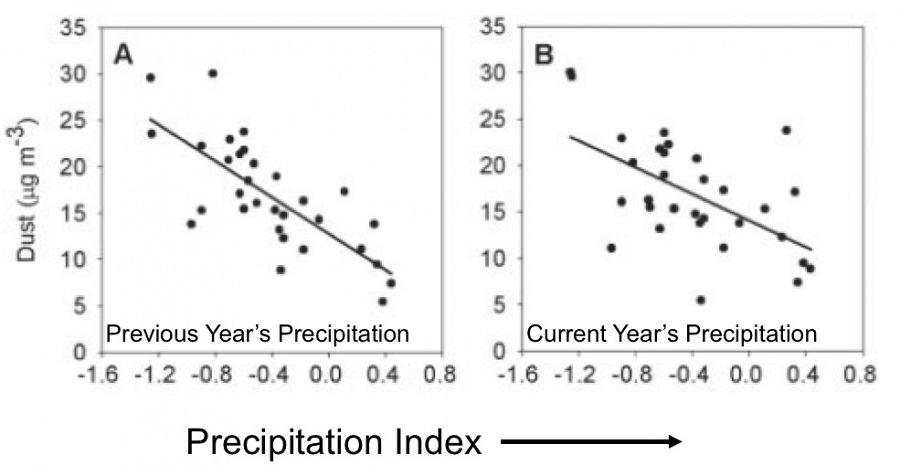
Rain patterns in the Sahel versus the amount of dust exported to the Caribbean.
These scatter plots are from Prospero and Lamb (2003): African droughts and dust transport to the Caribbean: climate change implications. Science 302: 1024-1027.
These dust measurement come from the island of Barbados.
The x-axis (independent variable) is a composite precipitation measurement describing precipitation in the Sahel. The important feature of the independent variable is that precipitation increases going from left to right.
The y-axis (dependent variable) shows mean dust loads from May- September in Barbados.
Panel A correlates dust loads against previous year’s precipitation index.
Panel B correlates dust loads against current year’s precipitation index.
These data show a strong relationship between rain patterns in the Sahel and the amount of dust exported to the Caribbean.
Students can use these data to formulate new hypotheses regarding the relationship between future changes in precipitation in North and West Africa, nutrient inputs into the Caribbean and Amazonia, and subsequent changes in primary production of these rainforest ecosystems.
2) Students research examples of global transport (H: See Supplementary Material)
Related Video: NASA | GEOS-5 Aerosols (1:34)
Simulation of aerosols depicted from August 2006 through April 2007. Demonstrates aerosol advection by weather and predominant wind patterns. Note: Date in lower-right corner.
Sea-salt (blue) is churned up from the ocean based on surface wind speeds, and most prevalent along mid-latitude storm tracks and frontal regions including the Southern Ocean.
Dust (red) is most prominent over the Saharan Desert and can be seen interacting with Atlantic tropical cyclones during the end of the 2006 Atlantic hurricane season (e.g. @ 15 seconds).
Organic and black carbon (green) are dispensed into the atmosphere from biomass burning, the most prominent for this period being over South America from Aug-Oct 2006, Indonesia from Sept-Nov 2006, Africa in January 2007.
Sulphate (white) can be seen from two primary sources: fossil fuel emissions over Asia, Europe and the US, and from volcanic emissions. There is a persistently active volcanic emission from Mt Nyiragongo in the Democratic Republic of the Congo, Africa, and then a large eruption from the Karthala Volcano on Grand Comore Island, Comoros in January of 2007 (@ 1:57).
Adapted from: http://gmao.gsfc.nasa.gov/research/aerosol/
3) Students research local examples from their community that receive external inputs (e.g. air quality).
The Critical Zone. Illustration modified from Chorover, J., R. Kretzschmar, F. Garcia-Pichel, and D. L. Sparks. 2007. Soil biogeochemical processes in the critical zone. Elements 3, 321-326. (artwork by R. Kindlimann). Image Request.
The ten Critical Zone Observatories (CZOs) of the U.S. NSF National CZO Program.
Adapted from: Introduction to Tropical Meteorology. 2nd Edition Chapter 3: Global Circulation. Produced by The COMET Program: http://www.comet.ucar.edu/
A massive sandstorm blowing off the northwest African desert has blanketed hundreds of thousands of square miles of the eastern Atlantic Ocean with a dense cloud of Saharan sand. NASA SeaWiFS image acquired February 26, 2000.
Detailed electron micrographs of individual dust particles common to the Saharan Air Layer and that arrive in Puerto Rico. Reid et al 2003. doi:10.1029/2002JD002935
The Luquillo Mountains, Puerto Rico. More info
Puerto Rico ecosystems. Wikipedia.
Mean Annual Precipitation, Luquillo Mountains, Puerto Rico. Climate Source Inc.
Rain patterns in the Sahel versus the amount of dust exported to the Caribbean.
Dust storm on mars. Notice the formation of the dust-jet similar to the African Easterly Jet (AEJ) from the African continent. Image Credit
Satellite image of dust storm moving west across Africa. Dust front is moving towards lower right hand corner of image. Image Credit.
Saharan dust arriving over the United Kingdom. March, 2003. Image Credit
News Category:
EDUCATION/OUTREACH
Files
AGI2015
(1 MB pdf)
The Influence of Dry Deserts on Tropical Rain Forests
AGI2015 - supplement
(2 MB pdf)
Supplement - The Influence of Dry Deserts on Tropical Rain Forests. African_Dust_Supplementary
AGI2015 - excel dataset
(534 KB xlsx)
Excel dataset - The Influence of Dry Deserts on Tropical Rain Forests. Rain_chemistry_data_AGI
People Involved
CZO
-

Luquillo, INVESTIGATOR
-

Luquillo, INVESTIGATOR
Non-CZO
Nick Guy - Associate Research Scientist, University of Wyoming
Explore Further
