Numerical Models
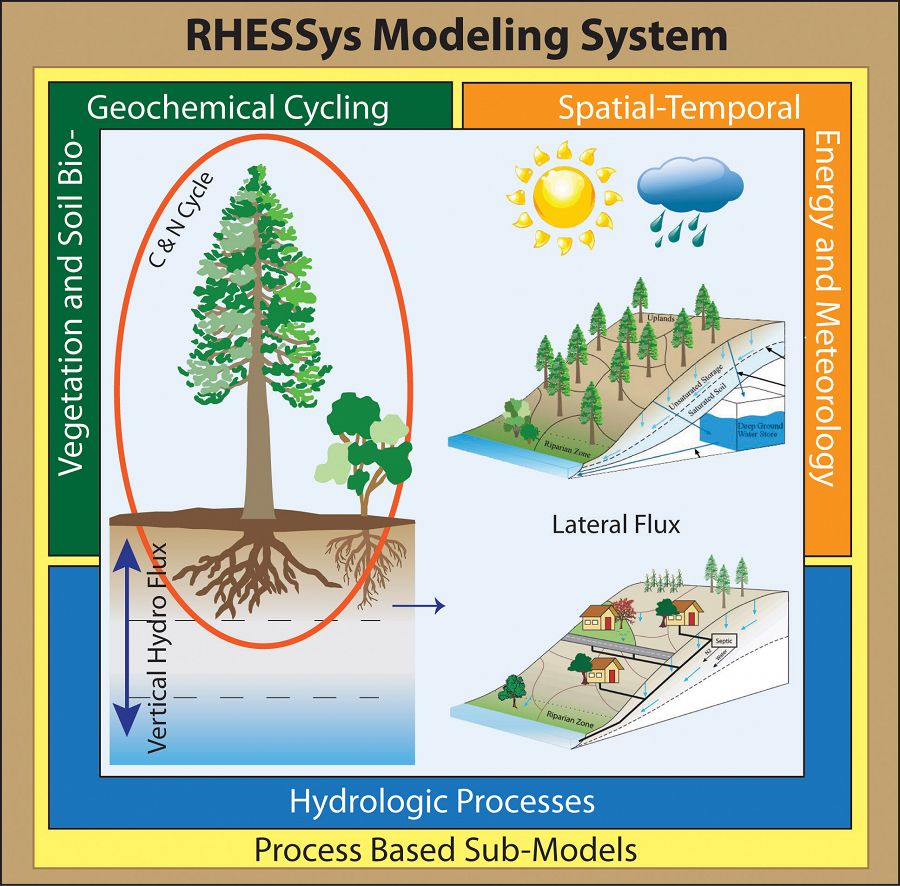
RHESSys (Regional Hydro-Ecologic Simulation System)
RHESSys is a spatially distributed dynamic model of coupled eco-hydrologic processes. Included in the model are mechanistic representations of vertical hydrologic processes (interception, soil and litter evaporation, canopy transpiration, infiltration, vertical drainage); lateral redistribution of moisture, nutrients, and streamflow production; and soil, plant carbon, and nitrogen cycling.
© Bren School of Environmental Science & Management; University of California, Santa Barbara
RHESSys
Regional Hydro-Ecologic Simulation System
A spatially distributed dynamic model of coupled eco-hydrologic processes.
Southern Sierra CZO data and RHESSys products
Using SSCZO measurements to refine RHESSys submodels and to develop efficient parameterization schemes
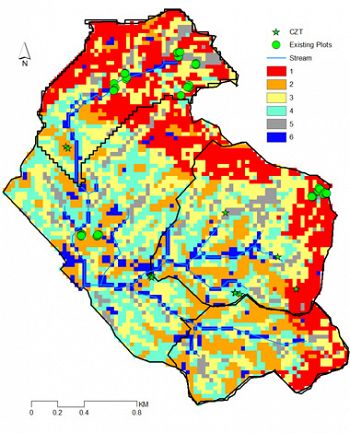
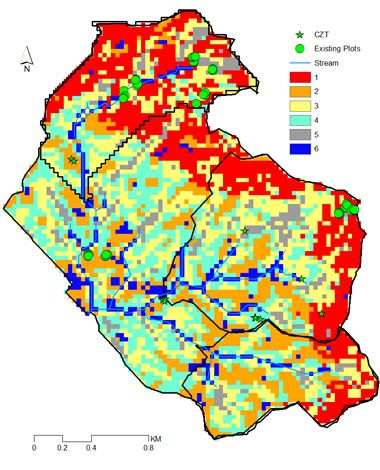
We also use RHESSys estimates to develop a strategic sampling design that emphasizes watershed scale responses to inter-annual climate variation and identifies gaps in current data collection New sampling locations are selected based on creating and clustering hydrologic similarity indices from model predictions of mean and inter-annual variation in snow, soil moisture and transpiration estimates. Additional field measurements (soil moisture and sapflux) are then taken to better represent areas of similar eco-hydrologic dynamics. The collected soil moisture and sapflux data are used to further constrain the soil and vegetation parameters for RHESSys modeling. We expect that constrained parameters will result in improving the model predictions and reducing predictive uncertainty.
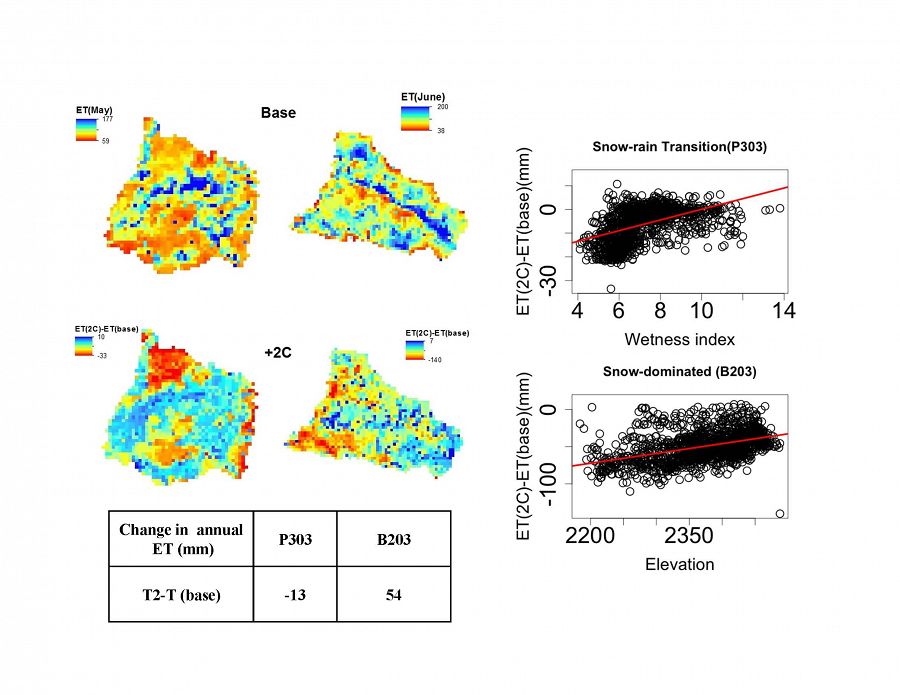
Climate warming scenarios
RHESSys estimates
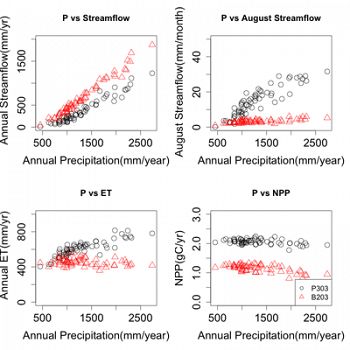
This figure shows RHESSys estimates of watershed total and summer streamflow, ET, vegetation productivity over historic climate variation.
Results show differences between a higher elevation watershed B203 with shallower soils and a lower elevation watershed with deeper soils. The model is used here to provide long-term estimates of responses to inter-annual variation in precipitation.
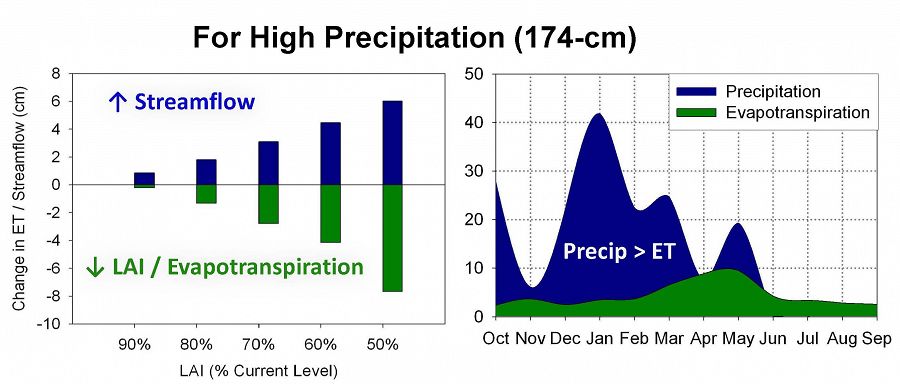
Streamflow can increase during high and low precipitation with reduced canopy
Modeling results for D102 in the left panel shows an increase of up to 6-cm streamflow (8%) with a 50% reduction in canopy cover under high precipitation conditions. The panel on the right shows how precipitation (including snowmelt) exceeds evapotranspiration demands during the wet winter months. This particular year (2005) shows early precipitation and snow melt peaking around January, with peak evapotranspiration occurring in May. 100% LAI = 6.1 in this catchment.
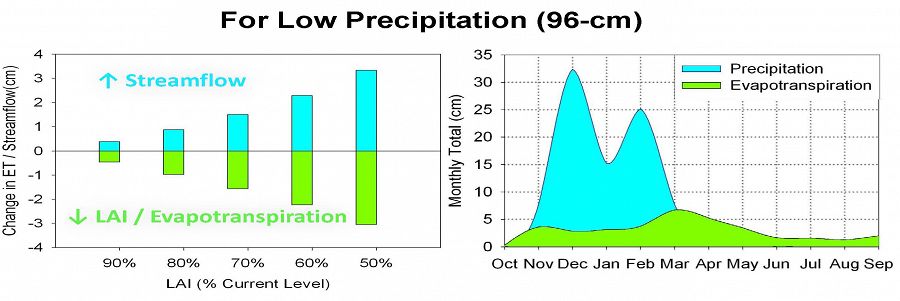
Modeling results for D102 during a low precipitation year also shows an increase of up to 3.5-cm streamflow (16%) with a 50% reduction in canopy cover (left panel). Many studies on forest reduction effects on streamflow show little to no increase in streamflow during dry years. In the Mediterranean climate of the Sierra Nevada, where most precipitation and snowmelt occurs within a short time period (< 6 months), precipitation still exceeds evapotranspiration demands during lower than average precipitation years (2004 here). 100% LAI = 6.1 in this catchment.
Model sensitivity and performance
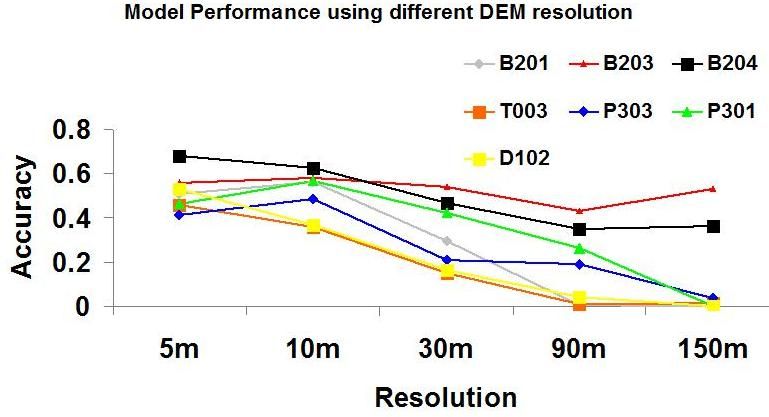
The sensitivity of RHESSys streamflow prediction accuracy to the resolution of the DEM used (finest resolution is based on the LIDAR product and then coarsened).
In rain-snow transition watersheds we might expect that when we model at coarser resolutions we may no longer be able to capture fine scale snow dynamics that control streamflow responses. Since regional scale model applications are typically done at relatively coarse resolution, we need to quantify the potential loss in performance. The detailed measurements at the CZO provide an opportunity to do this. Here we show differing sensitivity among the CZO watersheds to the DEM resolution used for hydrologic modeling.
© Bren School of Environmental Science & Management; University of California, Santa Barbara
© Southern Sierra Critical Zone Observatory
© Southern Sierra Critical Zone Observatory
© Southern Sierra Critical Zone Observatory
© Southern Sierra Critical Zone Observatory
© Southern Sierra Critical Zone Observatory
© Southern Sierra Critical Zone Observatory
Explore Further
