The Colorado Storm and Flood of 2013
An enduring storm, extensive flooding, and geomorphology in action
In the week of September 9th, 2013, a stalled cold front over Colorado collided with warm, monsoonal air from the south, causing persistent, heavy rains. By September 15th, rainfall totals exceeded 17 inches (430 mm) in Boulder County, and records since 1893 for daily, monthly, and annual rainfall had been broken (UCAR/NCAR: "Inside the Colorado Deluge," by Bob Henson).
Rapid runoff from the steep, impenetrable terrain of the mountains and foothills, along with ground saturation and overland flow in urban areas led to extensive flooding along a stretch of almost 200-miles from north to south in the Front Range. Eight deaths were reported, ~11,000 people were evacuated, many earth dams burst or were overtopped, and the town of Lyons became an island without utilities or contact.
The flooding caused tremendous damage to buildings, roads, and utilities, and changed the landscape through significant erosion, sediment transport, and deposition. Scientists speculate that climate change may have played a role in creating this weather event, through having a slightly warmer atmosphere that can hold more water vapor (Climate Central: "Flood Ravaged Boulder, CO, Sets Annual Rainfall Record" by Andrew Freedman).
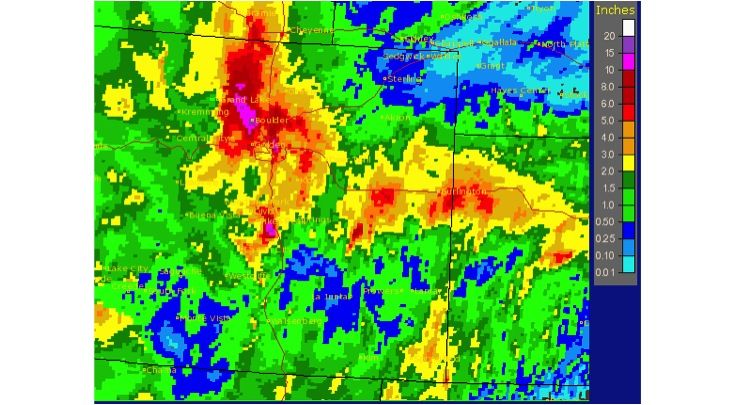
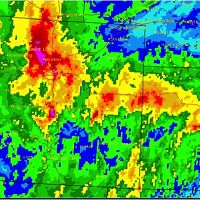
Fig. 1. Seven-day rainfall totals over Colorado, ending Sept. 13, 2013 (image courtesy of the NOAA National Weather Service). Note that totals over the Boulder area exceeded 17 inches of rain in one week.

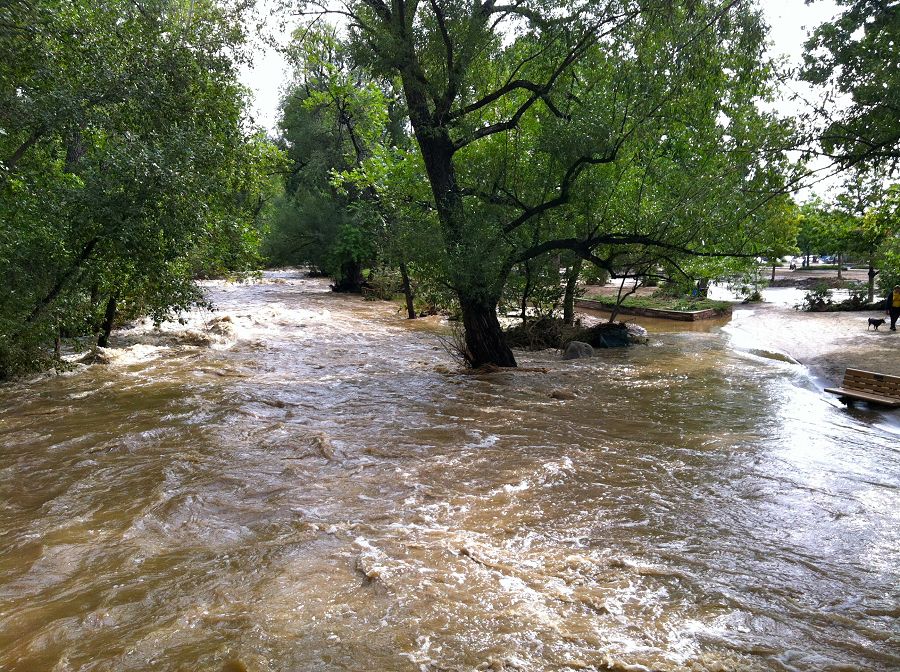
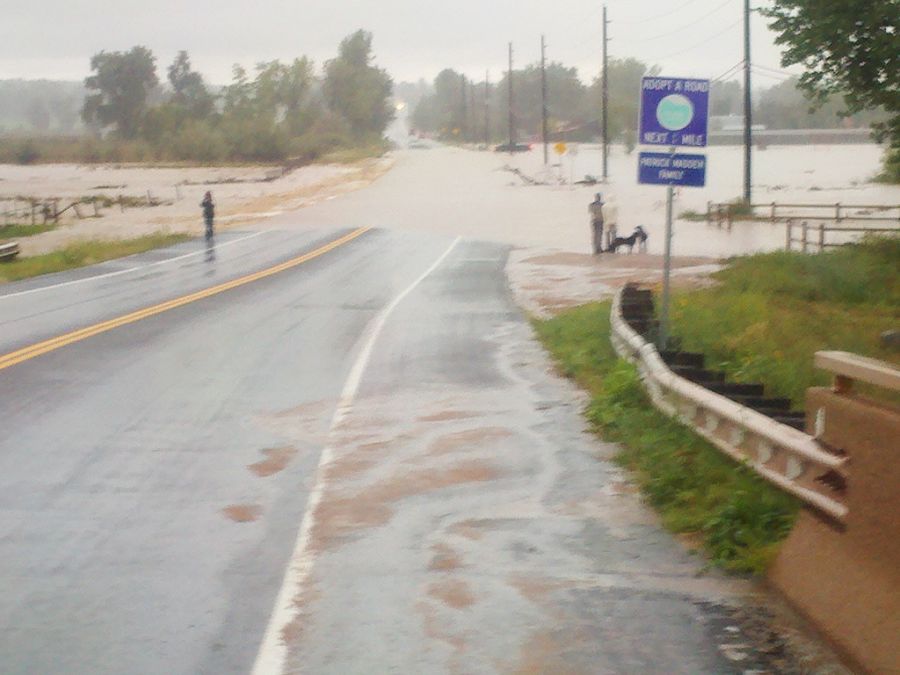
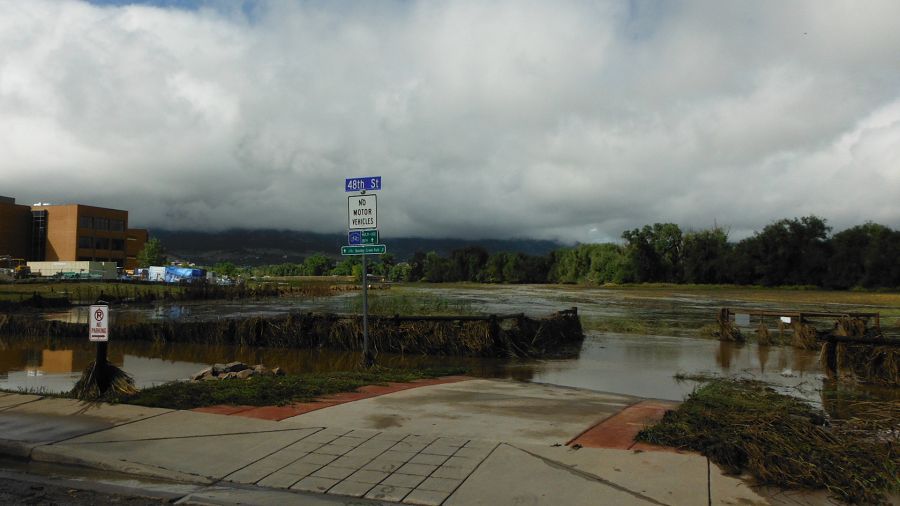
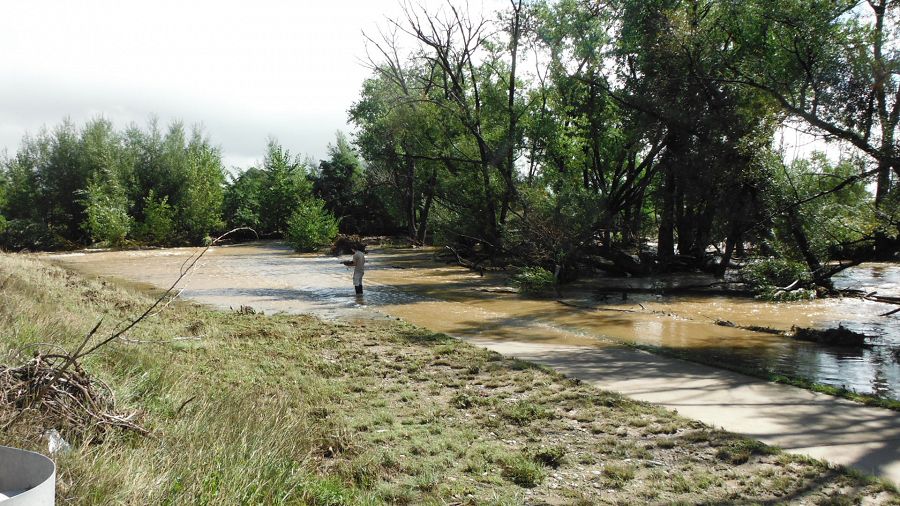
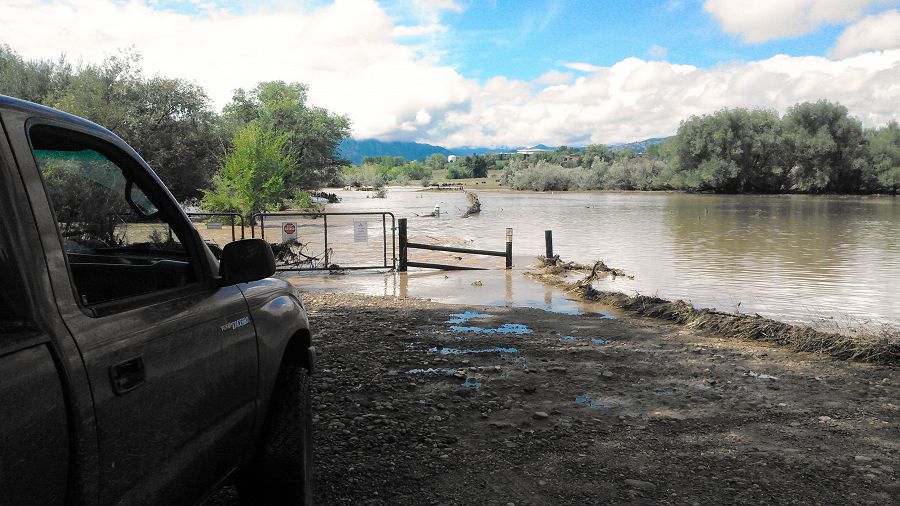
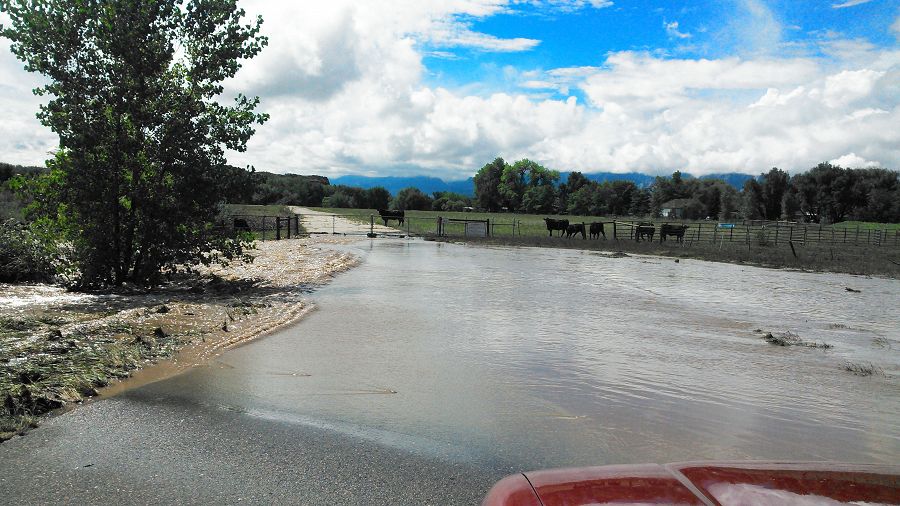
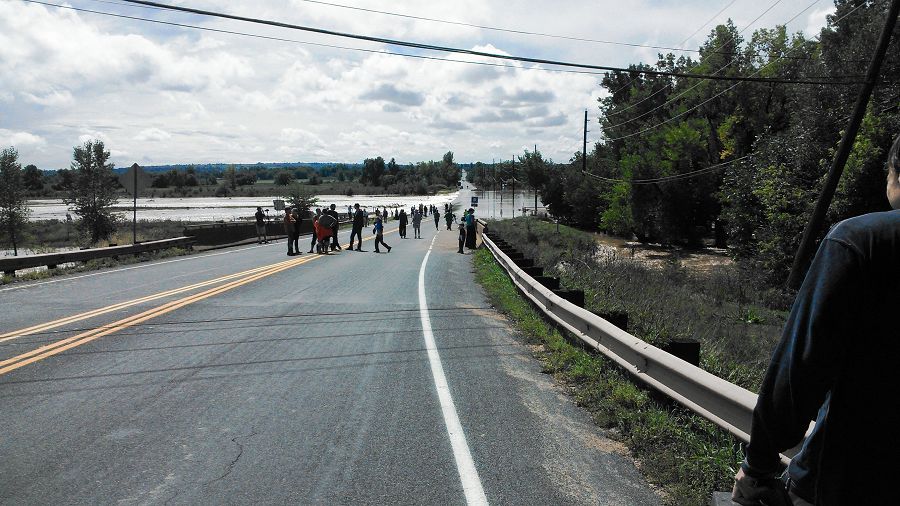
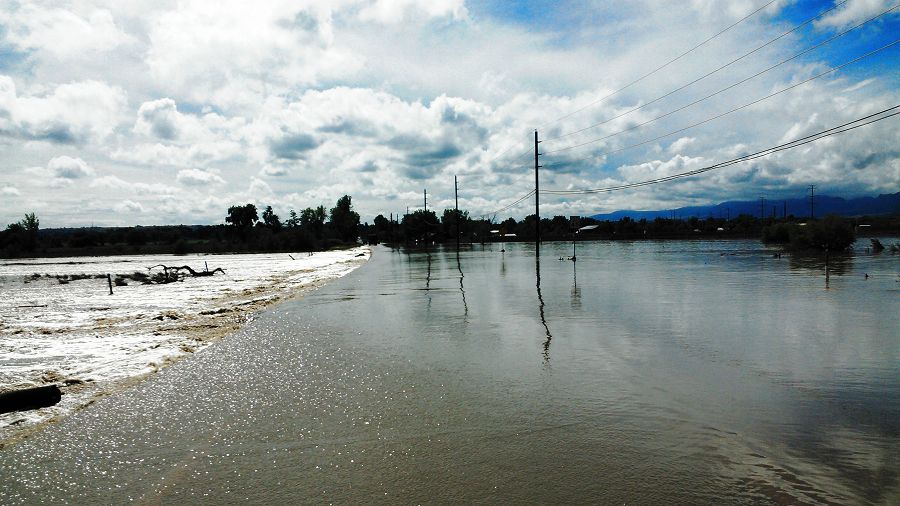
Fig. 2. A flooded highway in east Boulder County one day after the rain on Sept. 13 (photo credit Nate Rock).
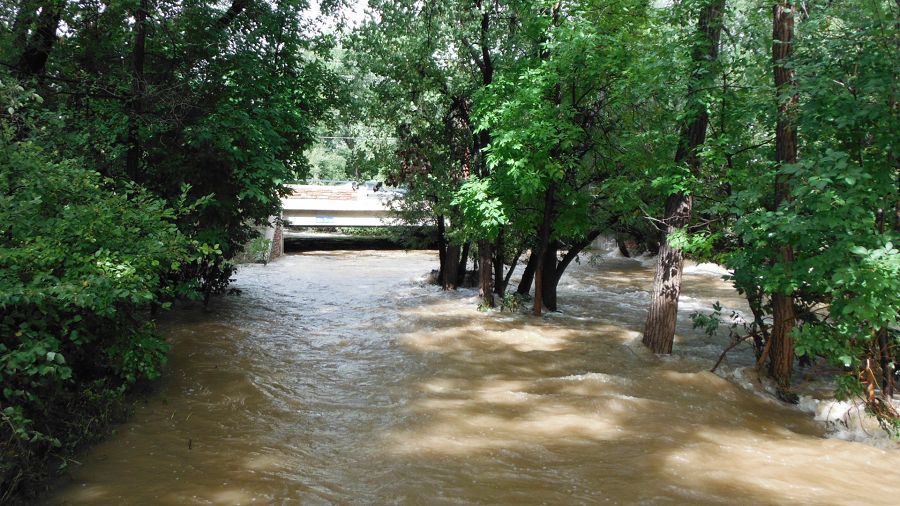
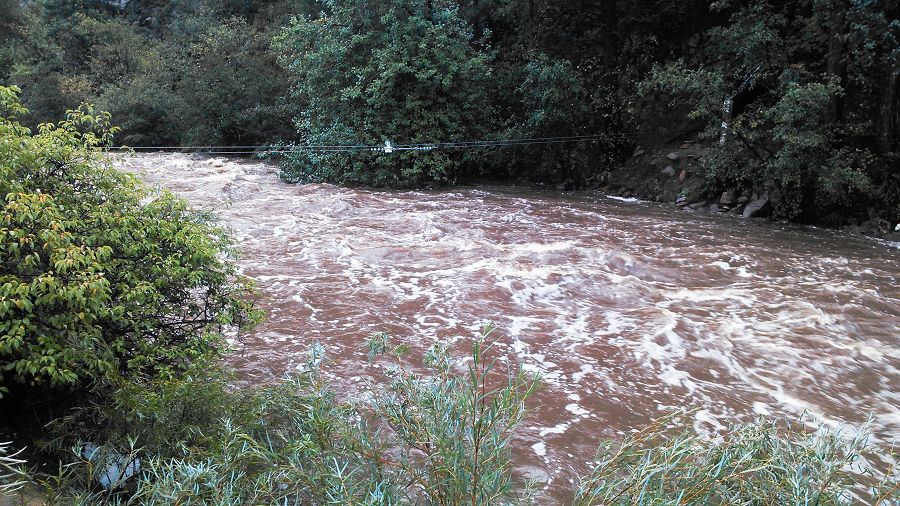
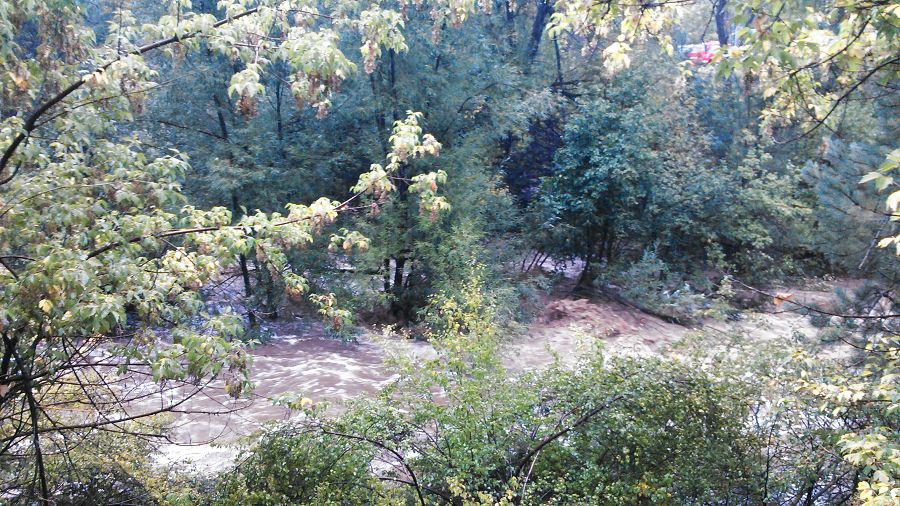
On September 12th, flow in Boulder Creek was exceeded 5,000 cubic feet (140 m3) of water per second, which is significantly higher than its regular flow, which is around 150–200 cubic feet (4.2–5.7 m3) per second. In spite of broken precipitation records, the extent of flooding along Boulder Creek did not exceed the largest flood on record, which occurred during snow melt in 1894.
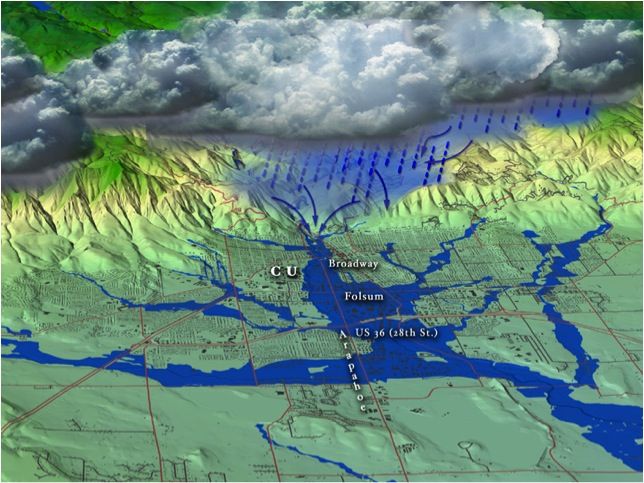
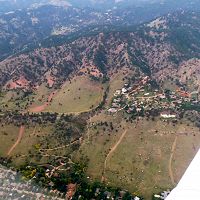
Fig. 3. A 3D-view diagram that shows the area that was mapped as the zone that would be flooded by a 1/500 probability per year event. Note that flooding was exacerbated by having a high-relief, low-permability landscape that funneled rain waterdown canyons and out onto the Plains. (Image courtesy of floodsafety.com)
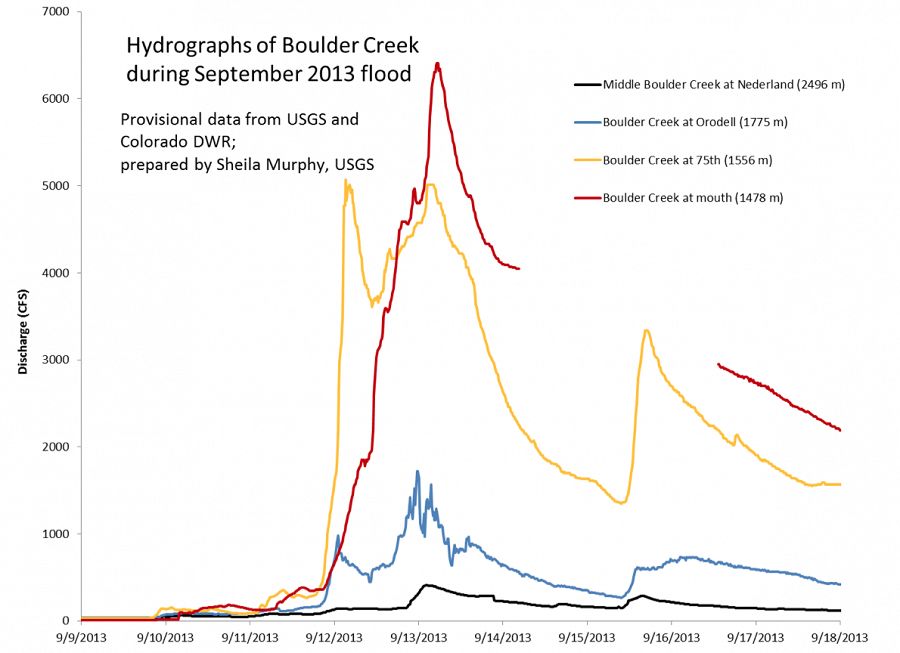
Fig. 4. Hydrographs of Boulder Creek during the September, 2013, rainfall and flood event. Provisional data is from the USGS and Colorado DWR, and were prepared by Sheila Murphy.
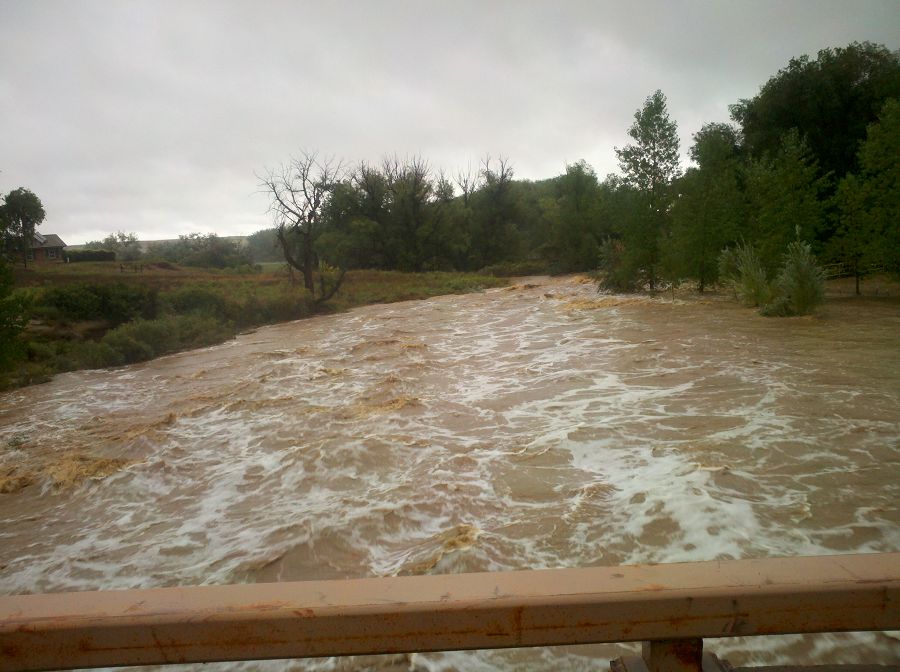
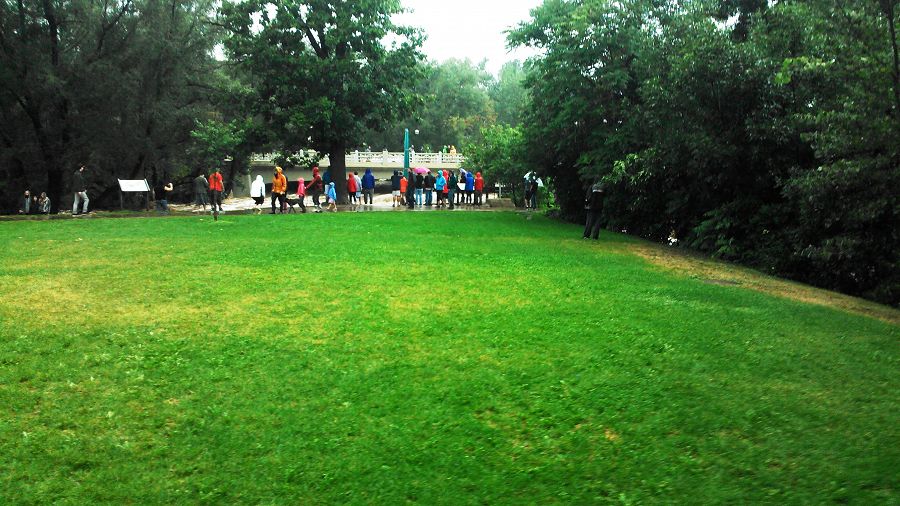
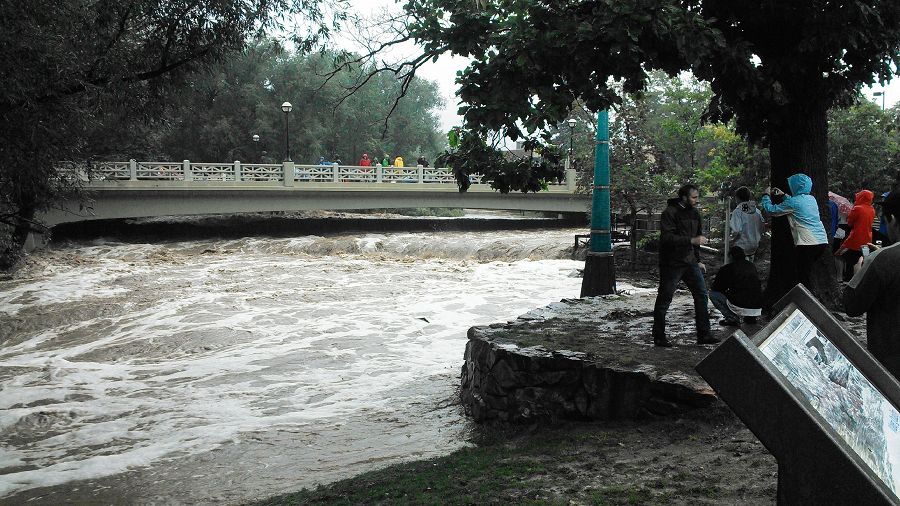
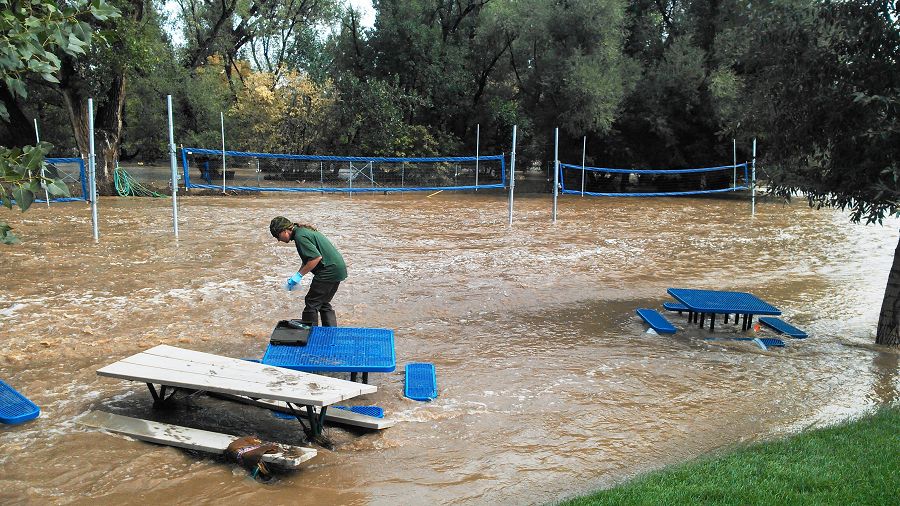
Fig. 5. Flooding near the Boulder Public Library along Boulder Creek, three days after the peak flow (photo credit Val Sloan).
Numerous landslides and debris flows lined the hills and in some cases flowed into homes and streets. In some cases, debris-flows dammed overland flow, and this water then combined with the debris to make dangerous slurries.
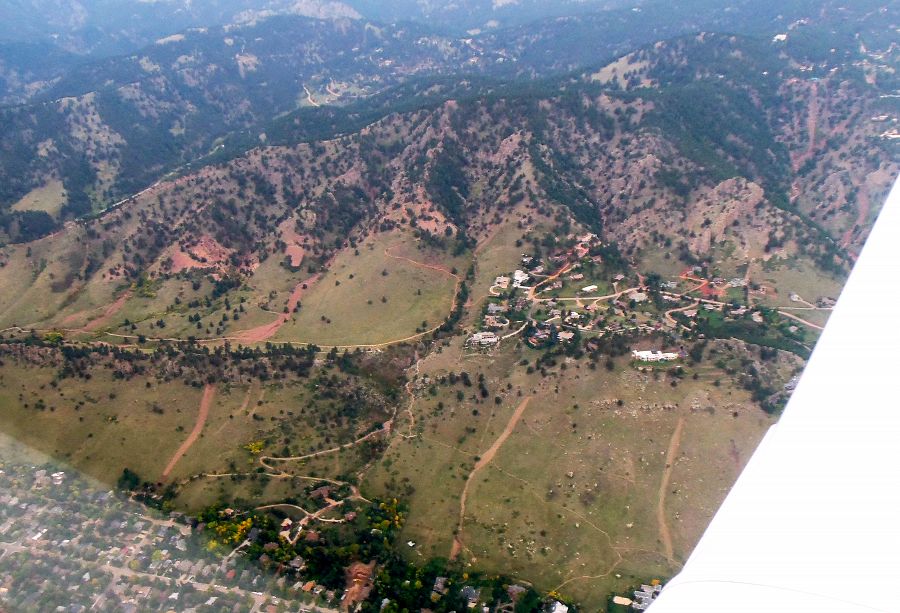
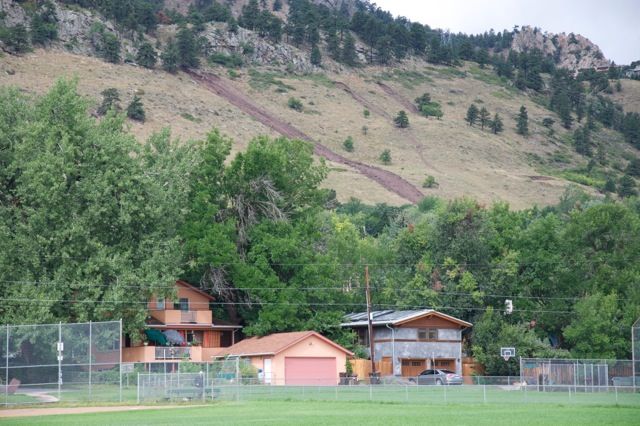
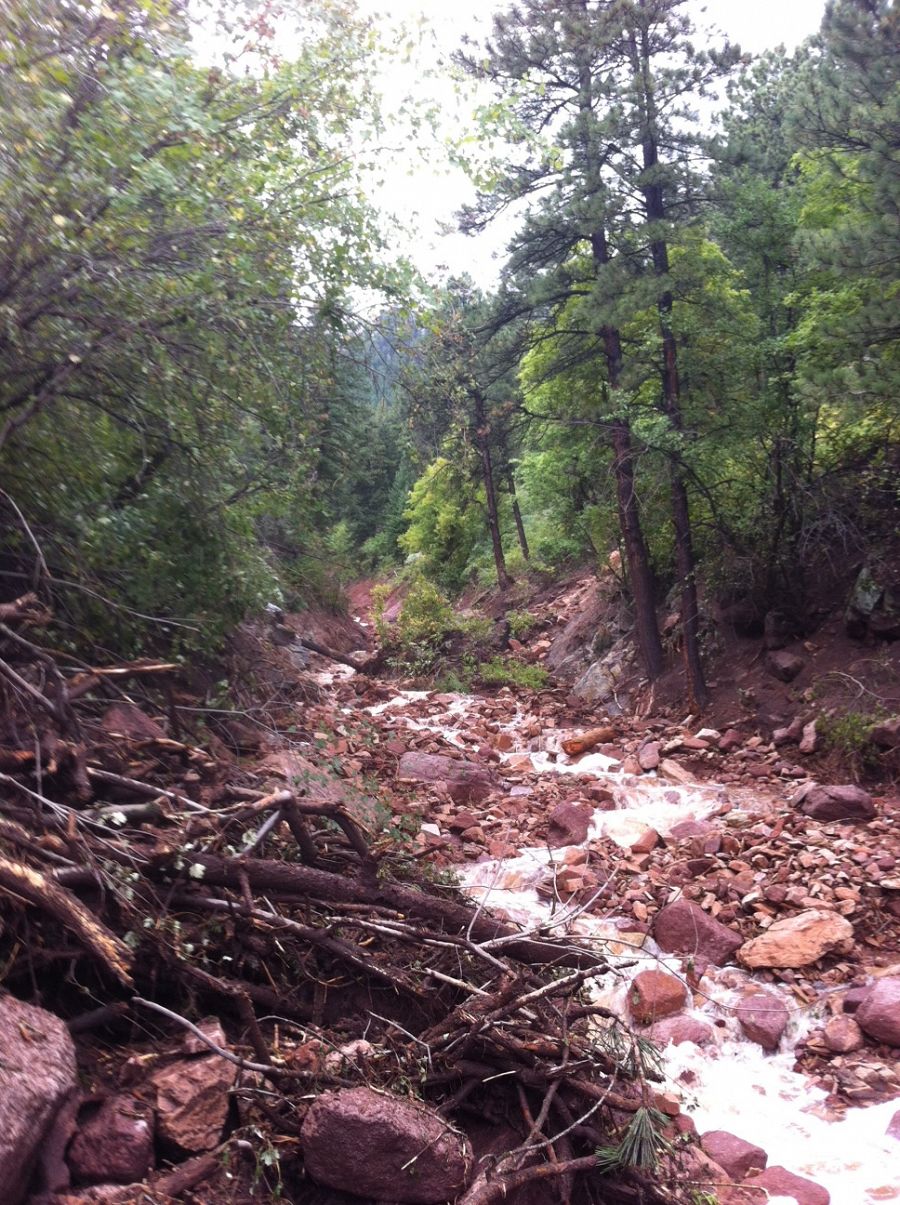
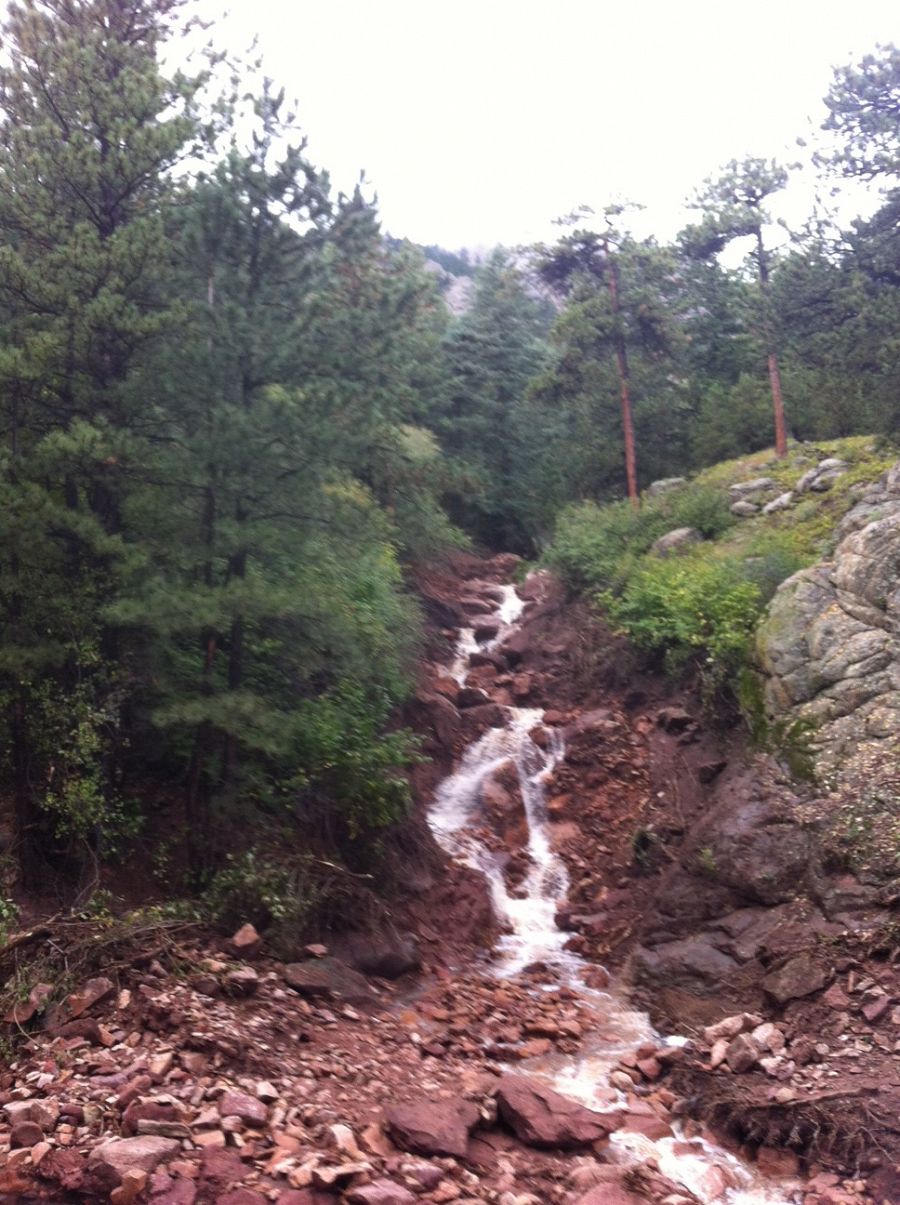
Fig. 6. Fresh landslides were triggered during and after the flood along the foothills near Boulder. These are believed to be translational landslides that evolved into debris flows (J. Godt, pers. comm.). (Photo credit Nate Rock, Oct. 3, 2013).
Local hydrologists and geomorphologists were astounded by the rapid and catastrophic processes that carved out sections of river banks, and dumped mounds of cobbles and sediment along the flood paths. Scientists and non-scientists alike discussed questions such as whether individual drainages differed from each other in terms flooding response, and which factors might have influenced those responses, including spatial variations in precipitation or burn characteristics in the upper watersheds, or urban landscape modification in urban areas.
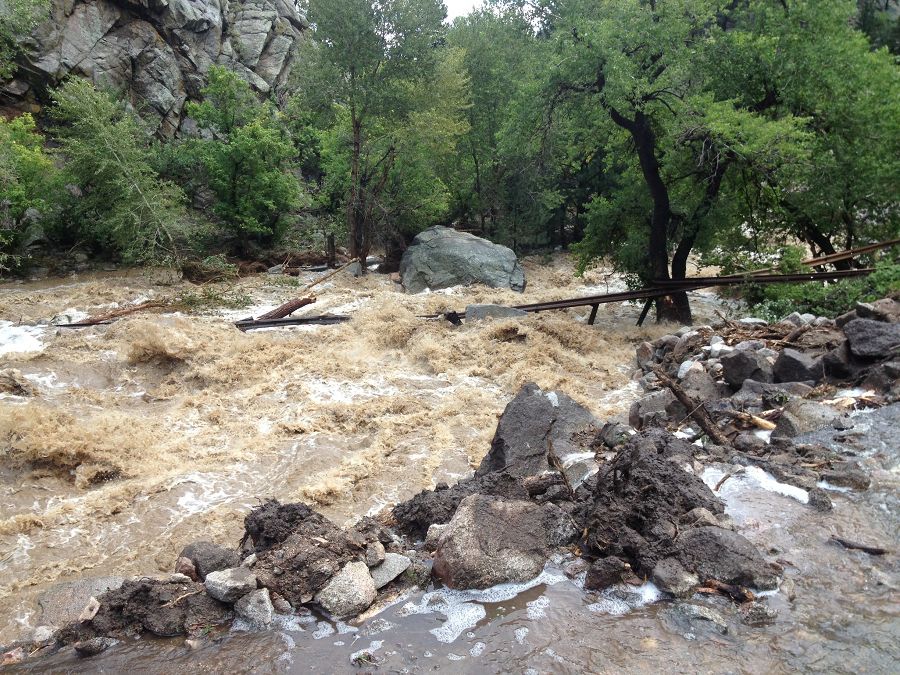
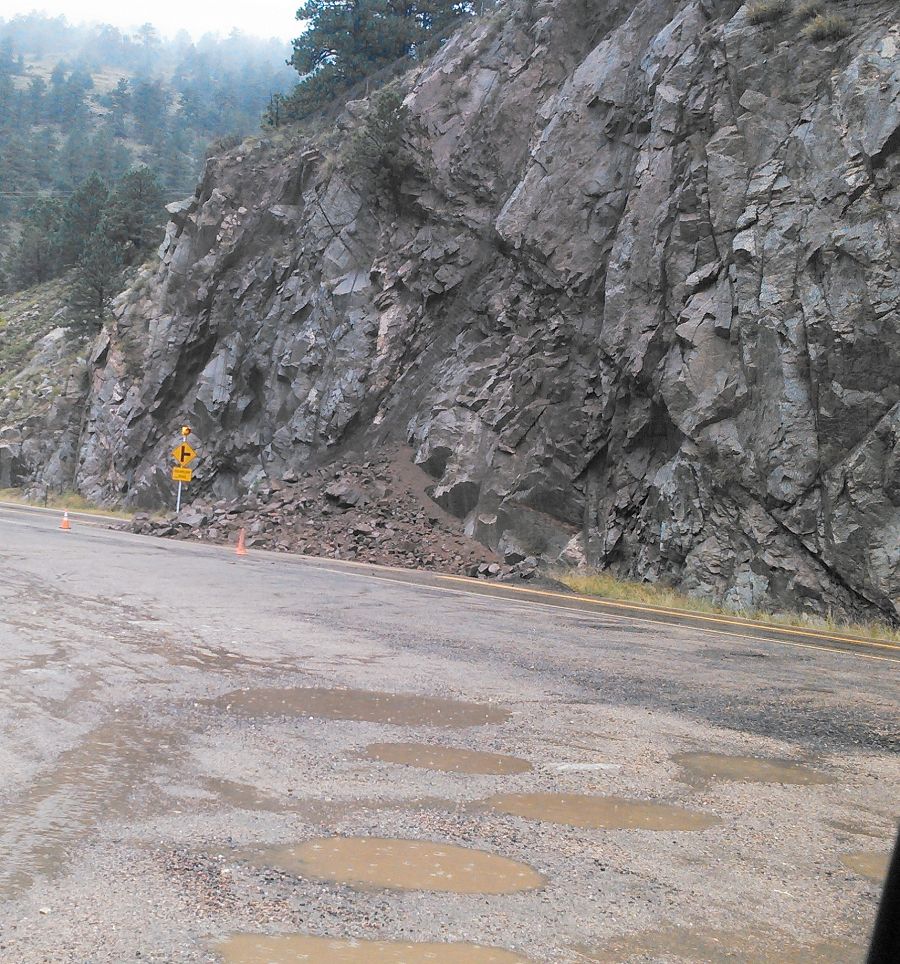
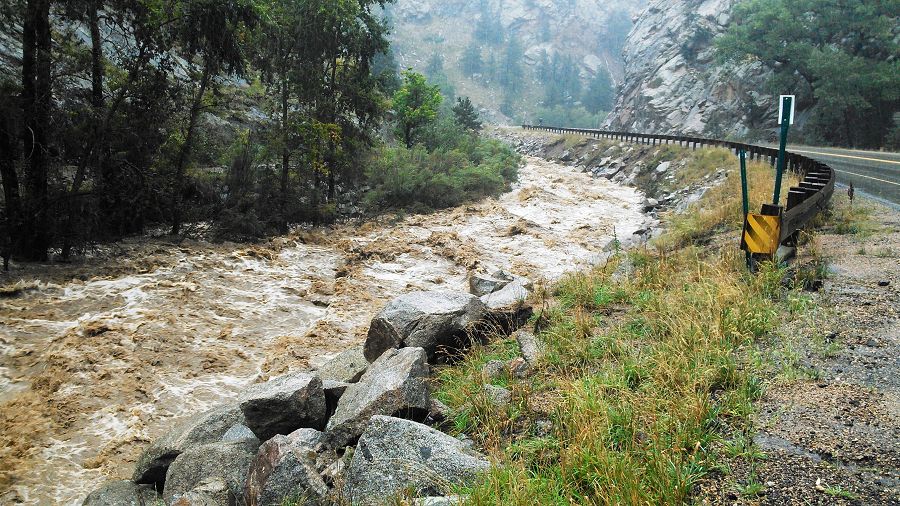
Fig. 7. In lower Boulder Canyon, the raging creek destroyed portions of the highway. The guard rail can be seen in the river. Photo was taken on Friday, Sept. 13th, by Bruce Vaughn.
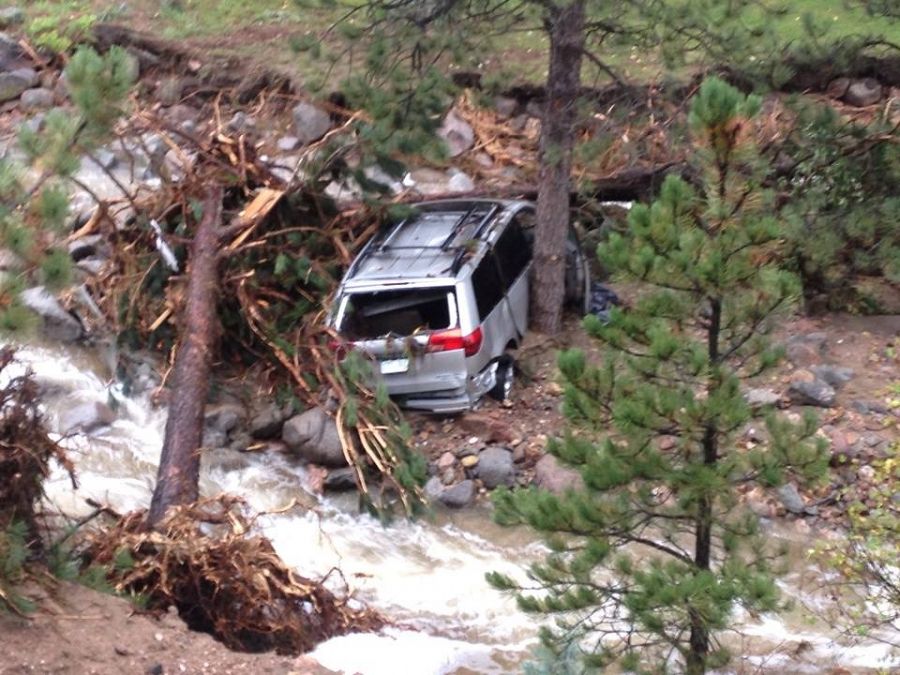
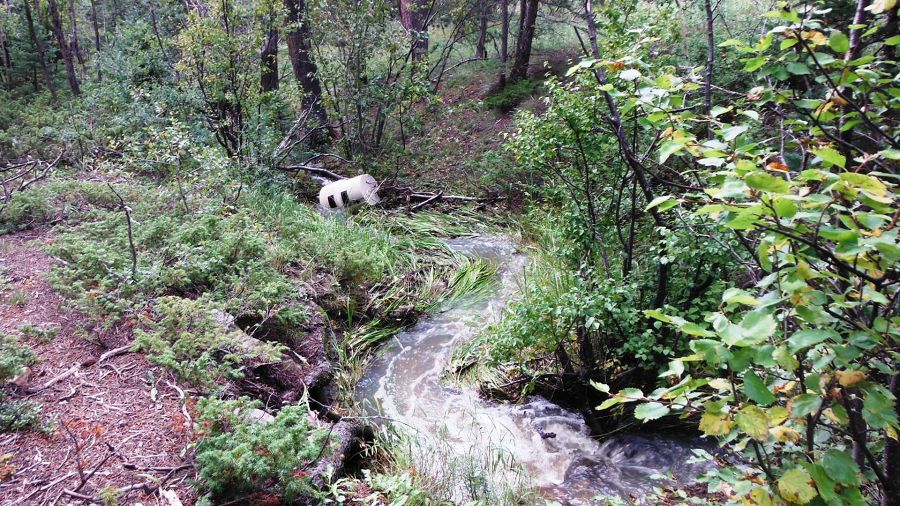
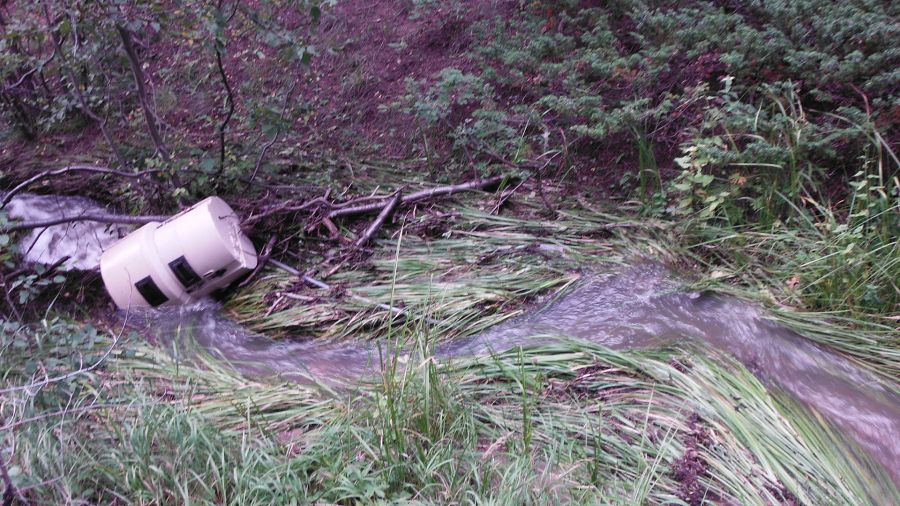
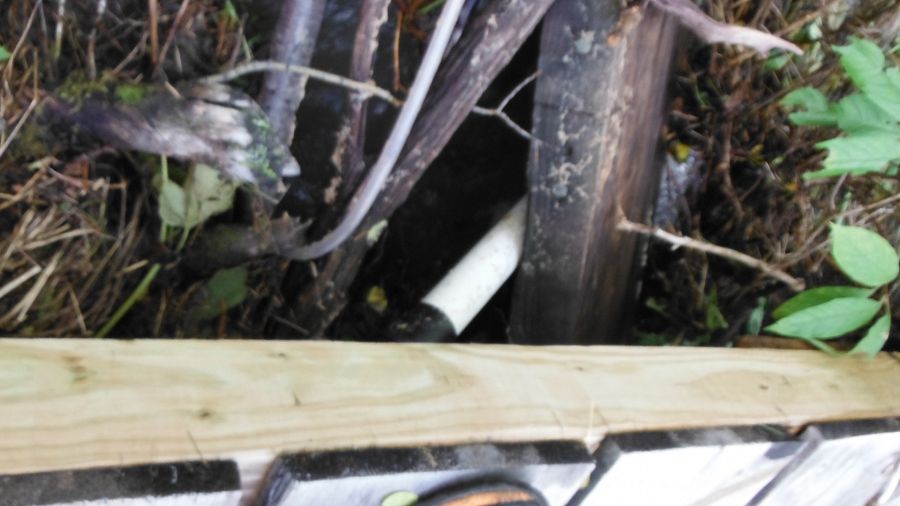
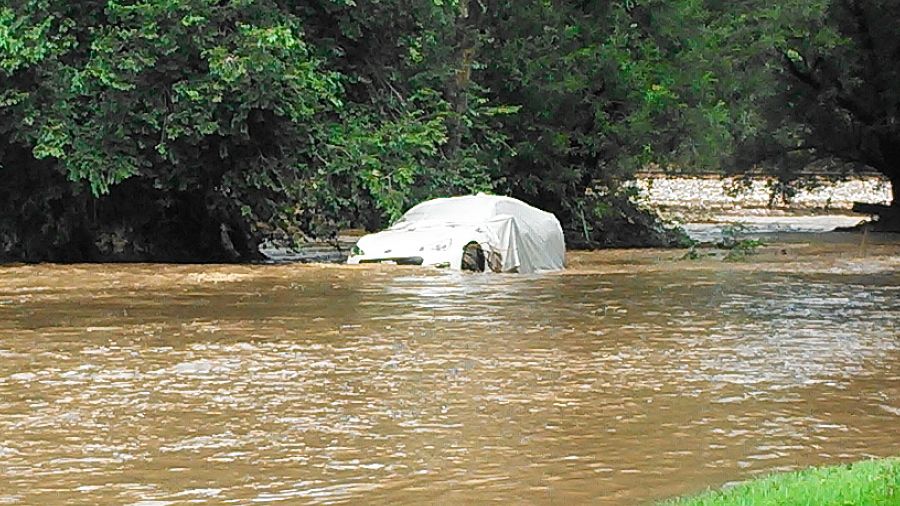
Fig. 8. Fourmile Canyon Creek near Lee Hill Drive in NW Boulder destroyed the road, carrying a van downstream, which created a dam for timber and sediment (photo credit Frederick Blume).
The dramatic erosion along small creeks and aggradation in those new channels provided a modern-day, scaled-down analog of the terrace-forming processes that are thought to have created the many terraces along Colorado's Front Range.
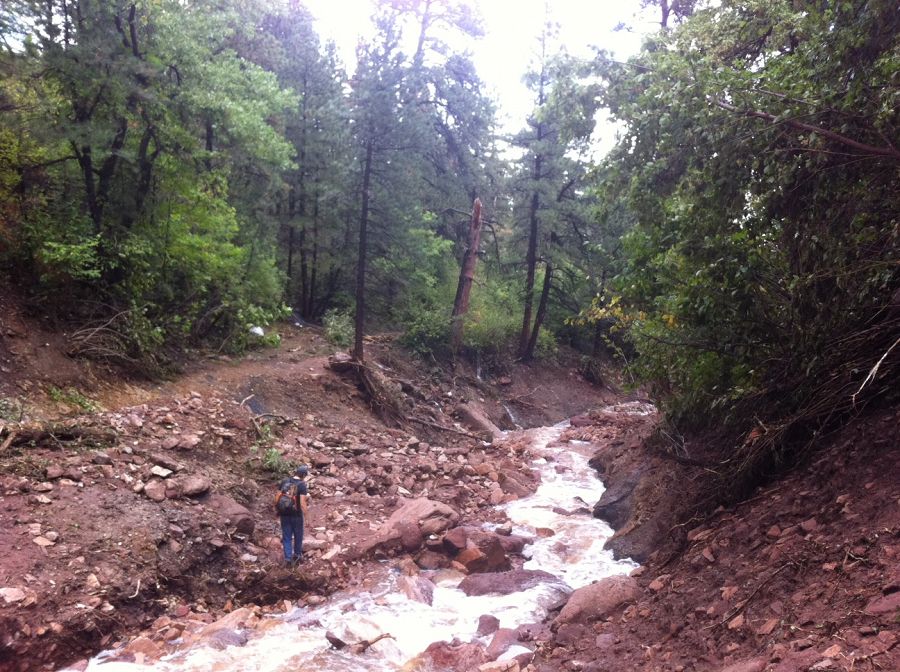
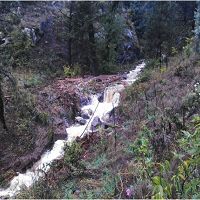
Fig. 9. Gully erosion along a former trail near the base of the First Flatiron, above Chautauqua Park in Boulder (photo credit Noah Fierer).
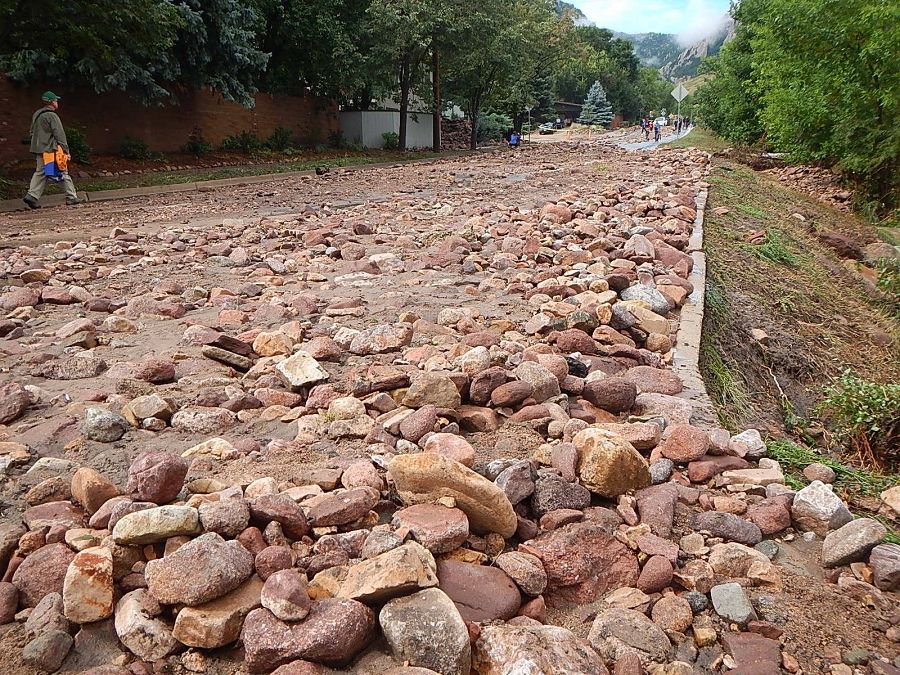
Fig. 10. Bear Creek flowed down Table Mesa Drive in south Boulder, leaving these cobble, gravel, and sand deposits. The photo was taken on Sept. 13th by Marieke Dechesne.
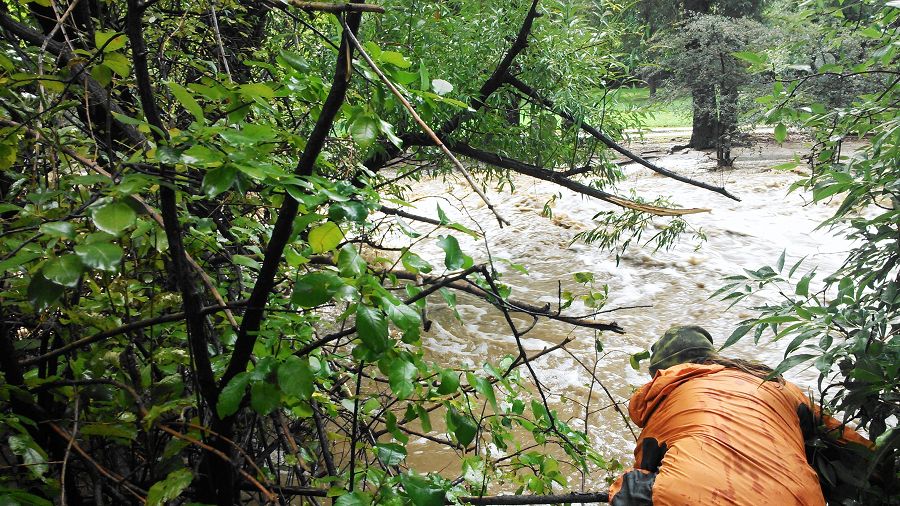
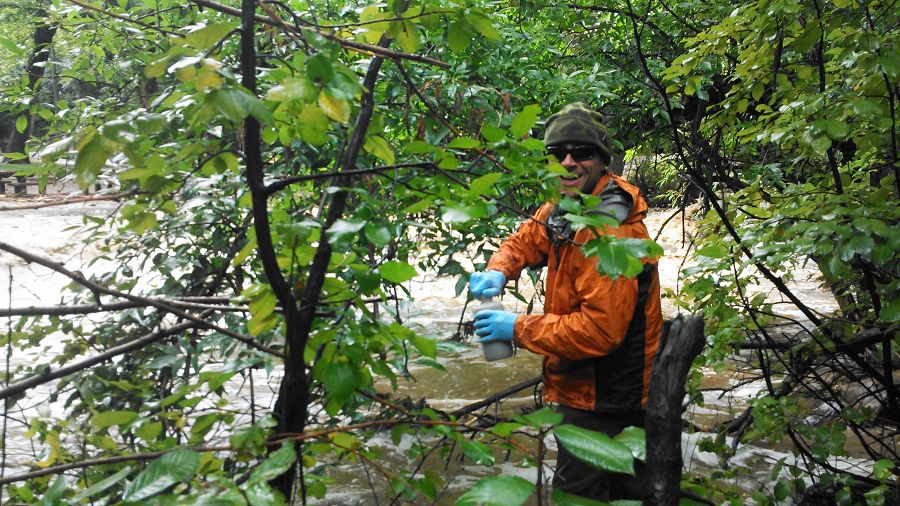
Scientists at the Boulder Creek Critical Zone Observatory at CU Boulder, the U.S.G.S., and other organizations are working to collect data on the sediment loads being carried by the rivers, water quality, stream hydrology, and the geomorphic impacts of the flood.
Relevant Links
NCAR/UCAR: Inside the Deluge: How much rain fell on the Front Range and how historic was it? - A comprehensive article with excellent graphics.
Climate Central: Flood Ravaged Boulder, CO., Sets Annual Rainfall Record - A discussion of how a warmer Earth may have contributed to this weather event.
The Denver Post: Colorado Floods 2013 - A collection of articles, maps, photos, and resources on the floods.
The Denver Post: Photos of the Flood - A collection of the most impressive photos of the floods.
Wikipedia: 2013 Colorado Floods - A short summary about the storm, precipitation, and impacts on communities.
The Huffington Post: Colorado Flooding Before and After Photos
NBC News: Colorado disaster: What is a 100-year flood? It's not what you think
City of Boulder: Boulder Creek Floodplain Mapping Guide - Access to maps and reports on flood zones, and more.
Boulder County: Boulder County Flood of 2013 - The County's website with resources on flood recovery.
Colorado Division of Water Resources Streamflow Stations Data Search Page - Create your own hydrograph from specific stations in Boulder County
USGS Science Feature: USGS Responds to Record Flooding in Colorado - Article about the flooding.
USGS September 2013 Southwest US Flood Events - Articles and maps on measured precipitation and "Annual Exceedence Probabilities"
Slate: Boulder is Flooding - Phil Plaitt's blog with video footage of Boulder Creek flooding.
Fig. 1. Seven-day rainfall totals over Colorado, ending Sept. 13, 2013 (image courtesy of the NOAA National Weather Service). Note that totals over the Boulder area exceeded 17 inches of rain in one week.
Fig. 2. A flooded highway in east Boulder County one day after the rain on Sept. 13 (photo credit Nate Rock).
Fig. 3. A 3D-view diagram that shows the area that was mapped as the zone that would be flooded by a 1/500 probability per year event. Note that flooding was exacerbated by having a high-relief, low-permability landscape that funneled rain waterdown canyons and out onto the Plains. (Image courtesy of floodsafety.com)
Fig. 4. Hydrographs of Boulder Creek during the September, 2013, rainfall and flood event. Provisional data is from the USGS and Colorado DWR, and were prepared by Sheila Murphy.
Fig. 5. Flooding near the Boulder Public Library along Boulder Creek, three days after the peak flow (photo credit Val Sloan).
Fig. 6. Fresh landslides were triggered during and after the flood along the foothills near Boulder. These are believed to be translational landslides that evolved into debris flows (J. Godt, pers. comm.). (Photo credit Nate Rock, Oct. 3, 2013).
Fig. 7. In lower Boulder Canyon, the raging creek destroyed portions of the highway. The guard rail can be seen in the river. Photo was taken on Friday, Sept. 13th, by Bruce Vaughn.
Fig. 8. Fourmile Canyon Creek near Lee Hill Drive in NW Boulder destroyed the road, carrying a van downstream, which created a dam for timber and sediment (photo credit Frederick Blume).
Fig. 9. Gully erosion along a former trail near the base of the First Flatiron, above Chautauqua Park in Boulder (photo credit Noah Fierer).
Fig. 10. Bear Creek flowed down Table Mesa Drive in south Boulder, leaving these cobble, gravel, and sand deposits. The photo was taken on Sept. 13th by Marieke Dechesne.
News Category:
RESEARCH |
EDUCATION/OUTREACH
Photos
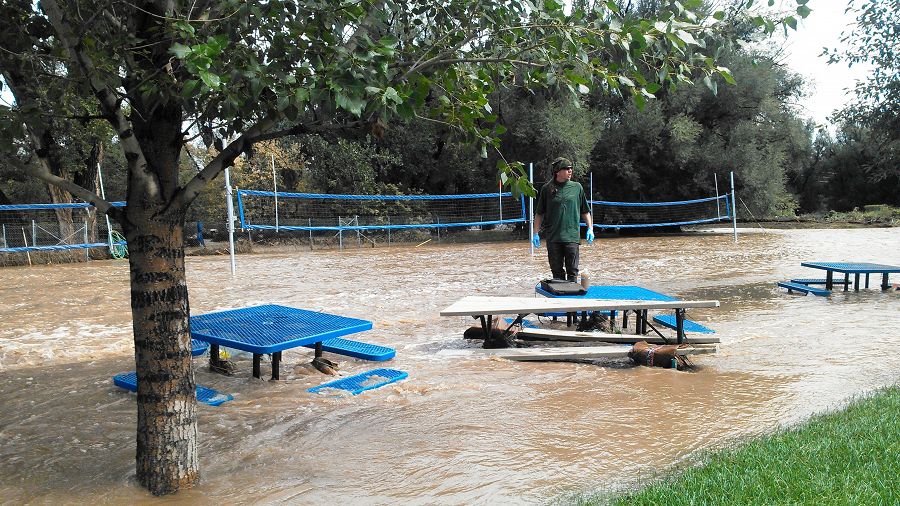
Boulder creek catastrophic flooding
Failure at about Forest St. from North Boulder Park (photo credit: Suzanne Anderson)
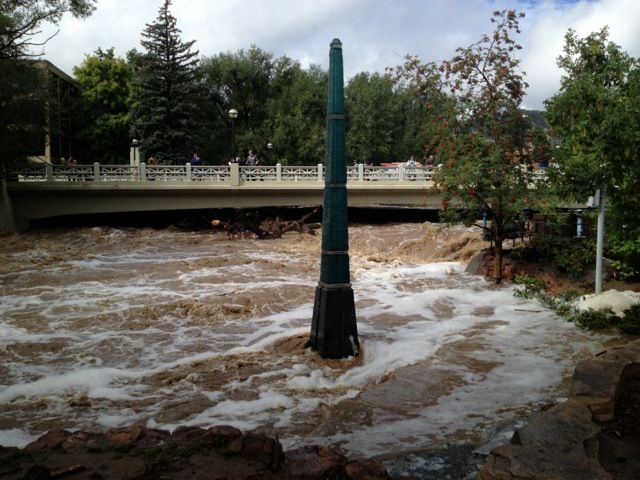
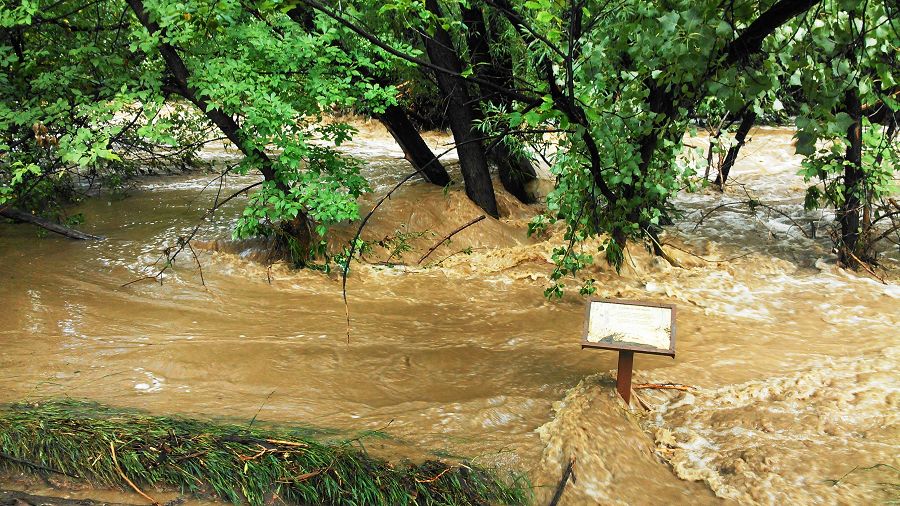
The Gilbert White Memorial Flood marker (top of the black base is the 50 year flood level). (photo credit: Suzanne Anderson)
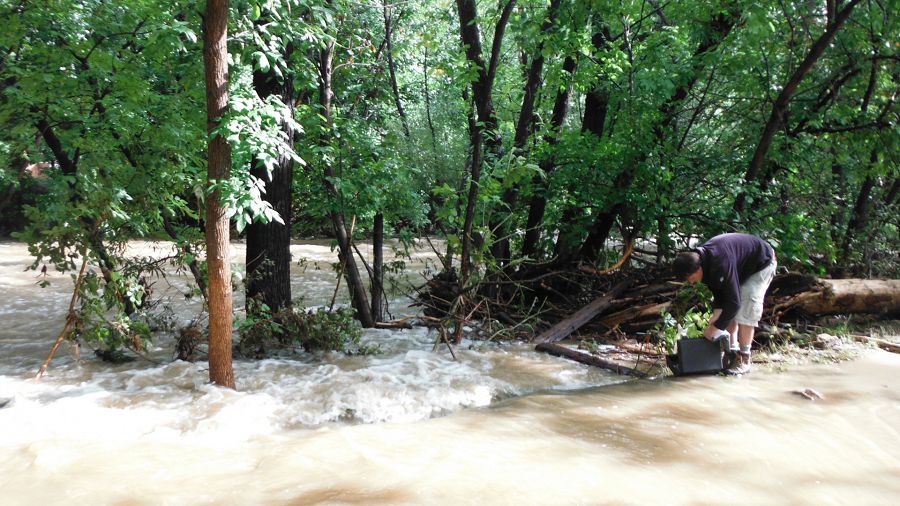
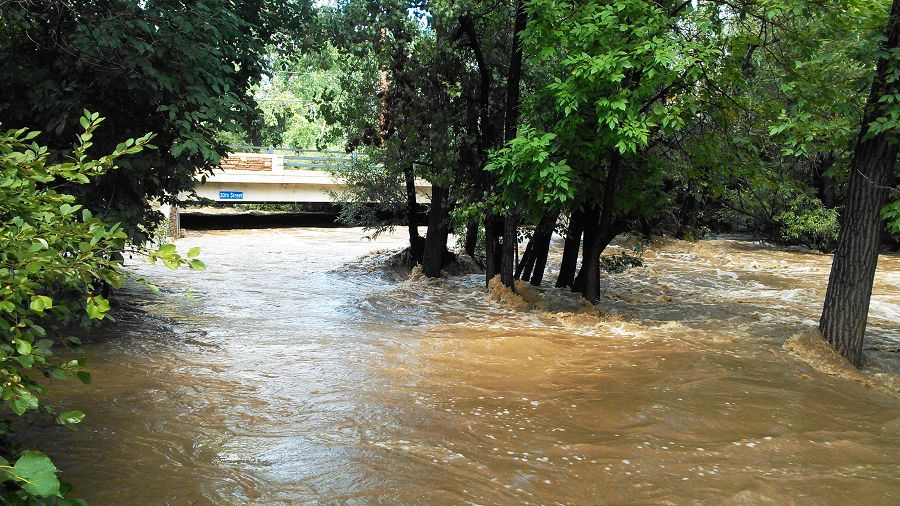
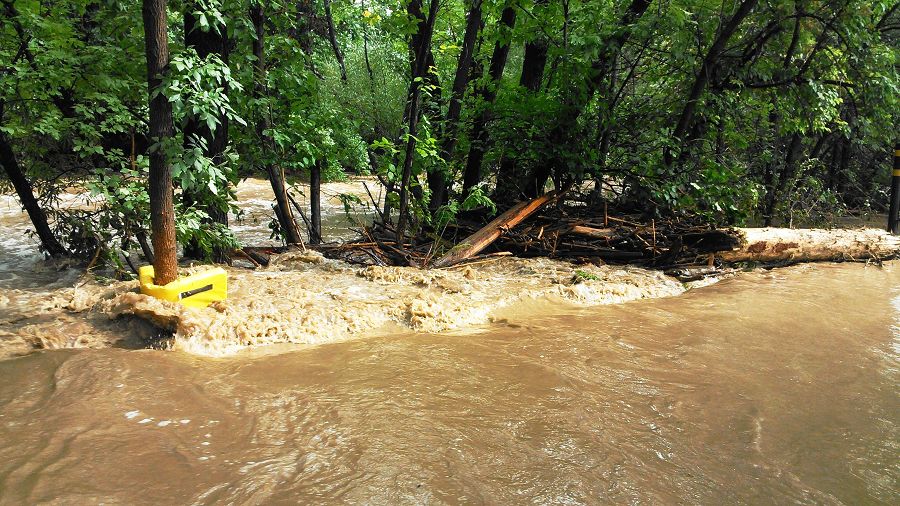
Pictures of the flow upstream and downstream of the bridge and the flooding on 75th east of the walden ponds. (photo credit: Harihar Rajaram)
Pictures of the flow upstream and downstream of the bridge and the flooding on 75th east of the walden ponds. (photo credit: Harihar Rajaram)
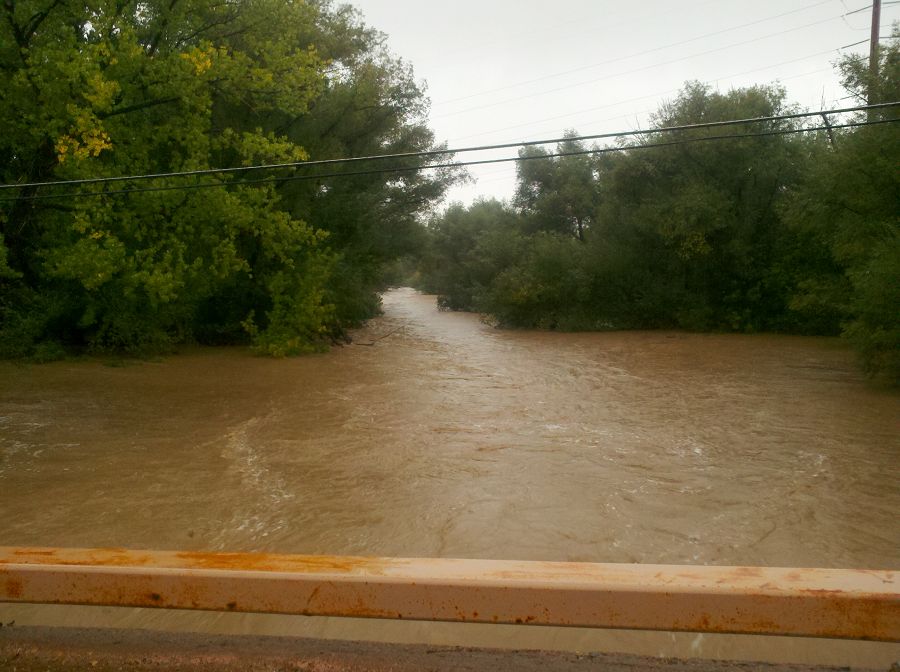
Pictures of the flow upstream and downstream of the bridge and the flooding on 75th east of the walden ponds. (photo credit: Harihar Rajaram)
Photos taken on a trail run this morning - base of Flatiron 1, above Chatauqua. Photo Noah Fierer
Photos taken on a trail run this morning - base of Flatiron 1, above Chatauqua. Photo Noah Fierer
Photos taken on a trail run this morning - base of Flatiron 1, above Chatauqua. Photo Noah Fierer
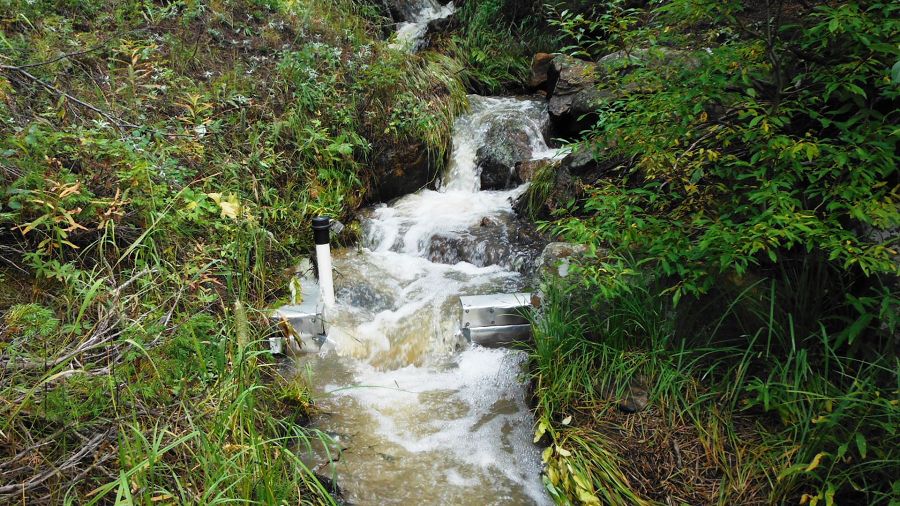
Stream gauge at Lower Gordon Gulch. Photo nate Rock
Stream gauge at Lower Gordon Gulch. Photo nate Rock
Stream gauge at Lower Gordon Gulch. Photo nate Rock
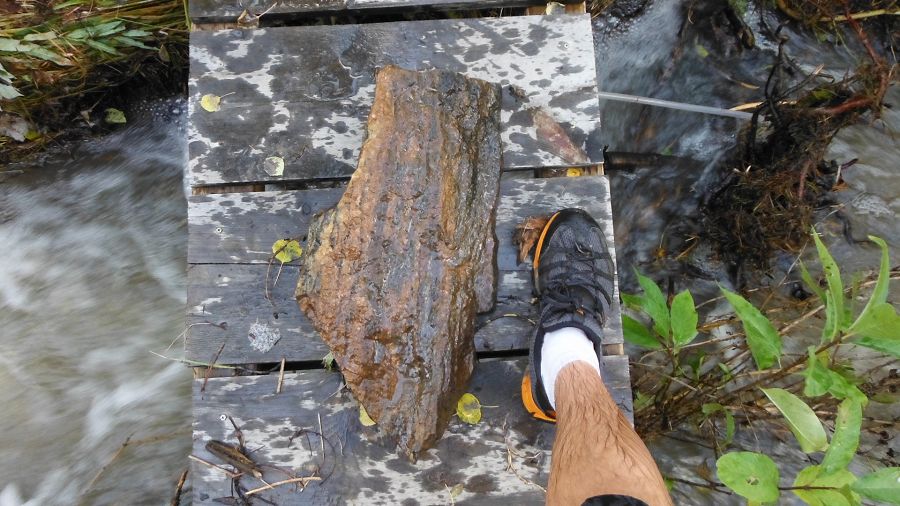
Large rock removed out of the debris stuck under the bridge! Photo nate Rock
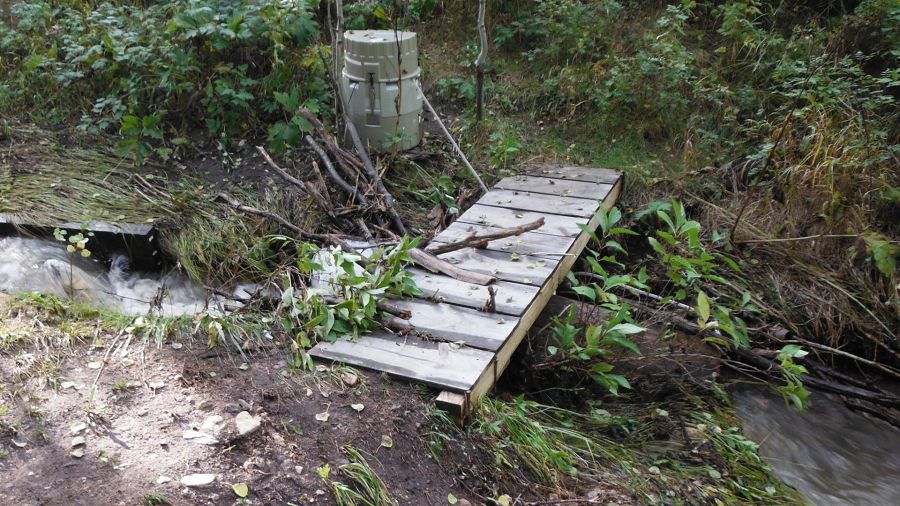
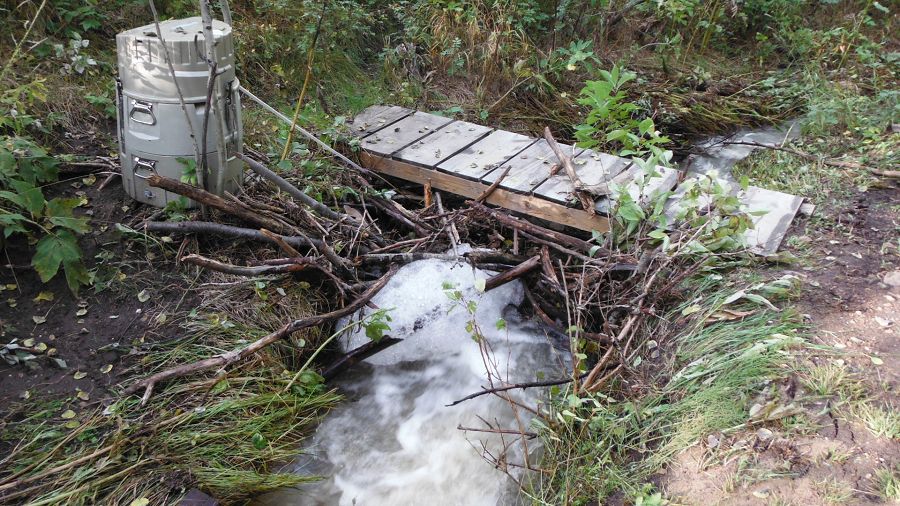
Post storm at Upper Gordon ISCO washed 15 m Upper Gordon Gulch. Photo Nate Rock
Post storm at Upper Gordon ISCO washed 15 m Upper Gordon Gulch. Photo Nate Rock
Post storm at Upper Gordon Gulch Stream Gauge
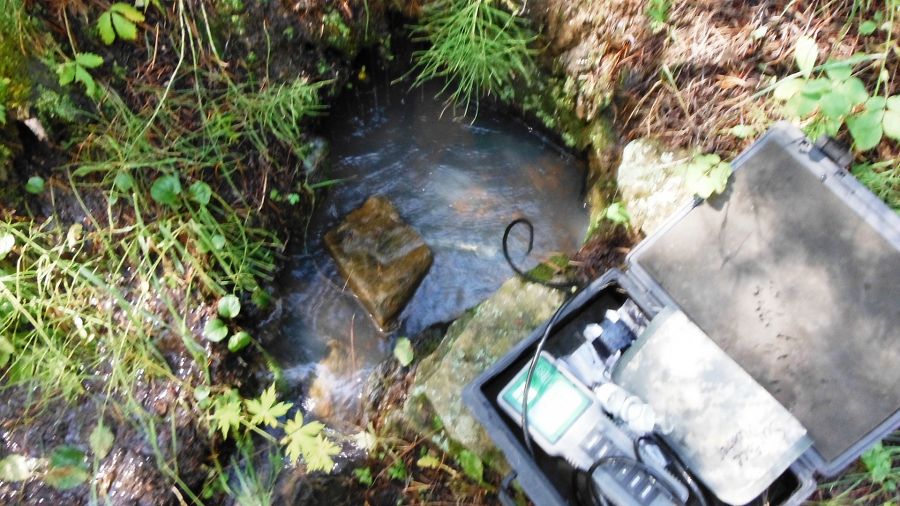
Sampling at Upper Gordon Gulch post storm (Need caption)
Upper Gordon post storm (Need caption)

Erosion on the road at Upper Gordon Gulch
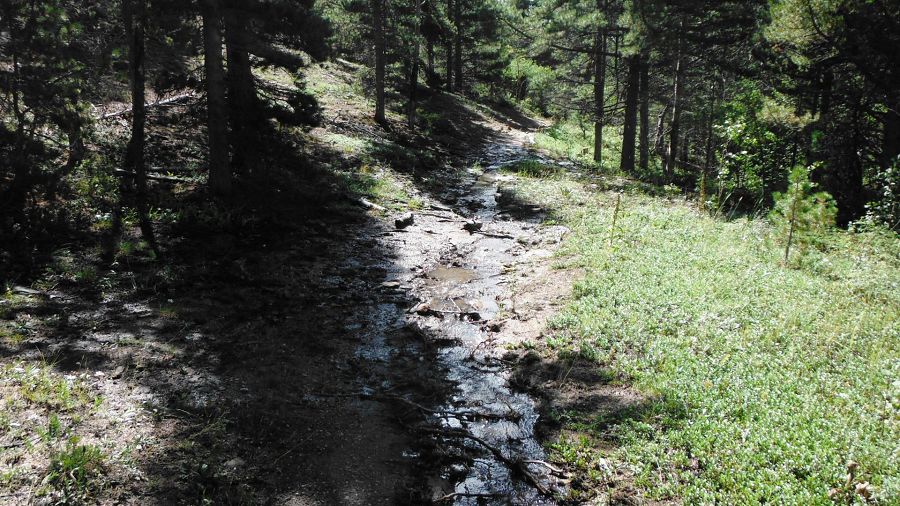
Water flowing at Upper Gordon Gulch
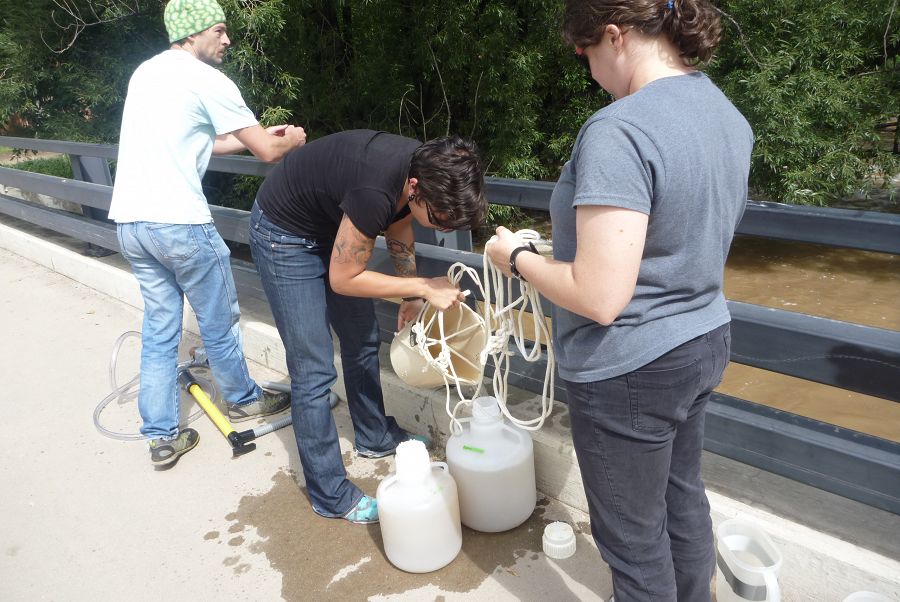
Rachel Gabor, Aneliya Sakaeva, and Chris Jaros helped collect samples of floodwater from Boulder Creek, Monday Sptember 16 2013
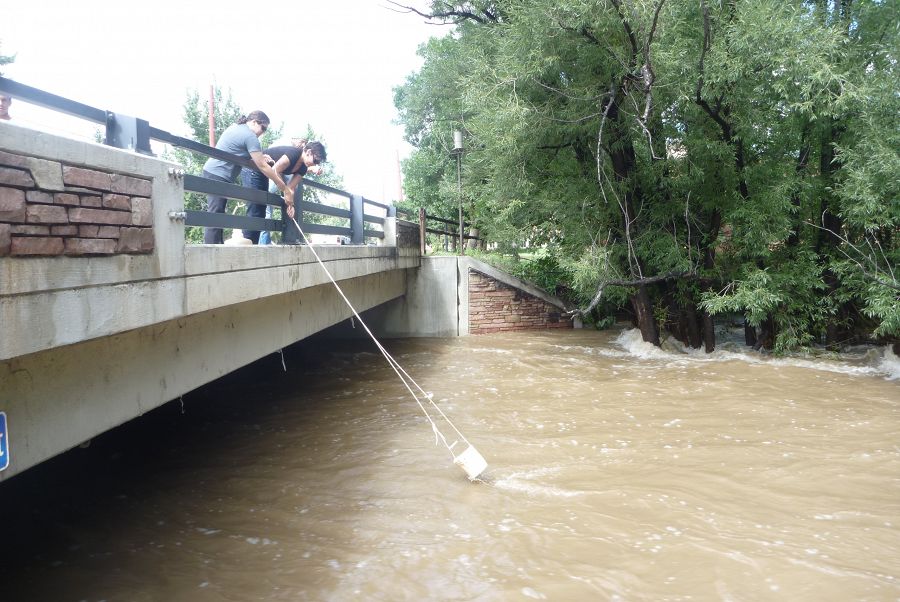
Sampling the Boulder Creek floodwater on Monday Sptember 16 2013 with a bucket method

Sampling the Boulder Creek floodwater on Monday Sptember 16 2013
Boulder Flood 2013 (Photo Nate Rock)
Boulder Flood 2013 (Photo Nate Rock)
Boulder Flood 2013 (Photo Nate Rock)
Boulder Flood 2013 (Photo Nate Rock)
Boulder Flood 2013 (Photo Nate Rock)
Boulder Flood 2013 (Photo Nate Rock) Lower Gorden Gulch
Boulder Flood 2013 (Photo Nate Rock)
Boulder Flood 2013 (Photo Nate Rock)
Boulder Flood 2013 (Photo Nate Rock)
Boulder Flood 2013 (Photo Nate Rock)
Boulder Flood 2013 (Photo Nate Rock) people watching flood waters
Boulder Flood 2013 (Photo Nate Rock) Boulder Creek in Boulder
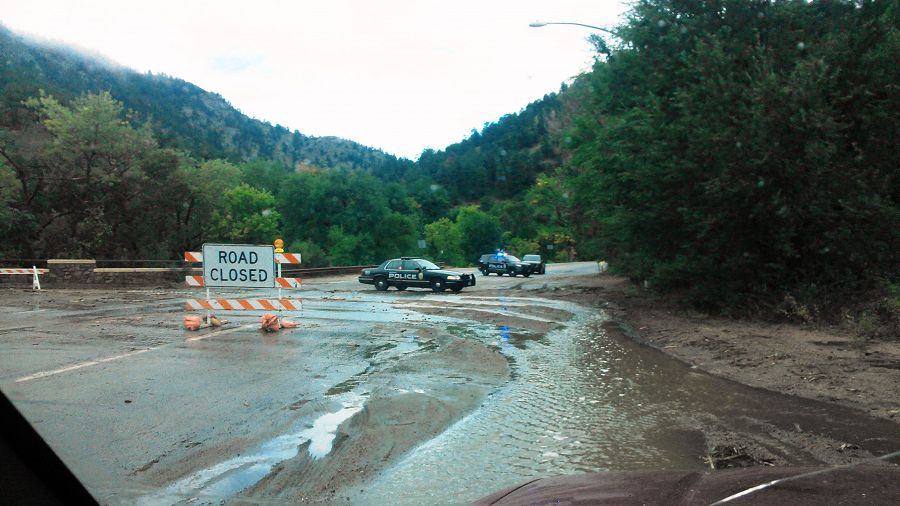
Boulder Flood 2013 (Photo Nate Rock) Road closure
Boulder Flood 2013 (Photo Nate Rock)
Boulder Flood 2013 (Photo Nate Rock) collecting samples
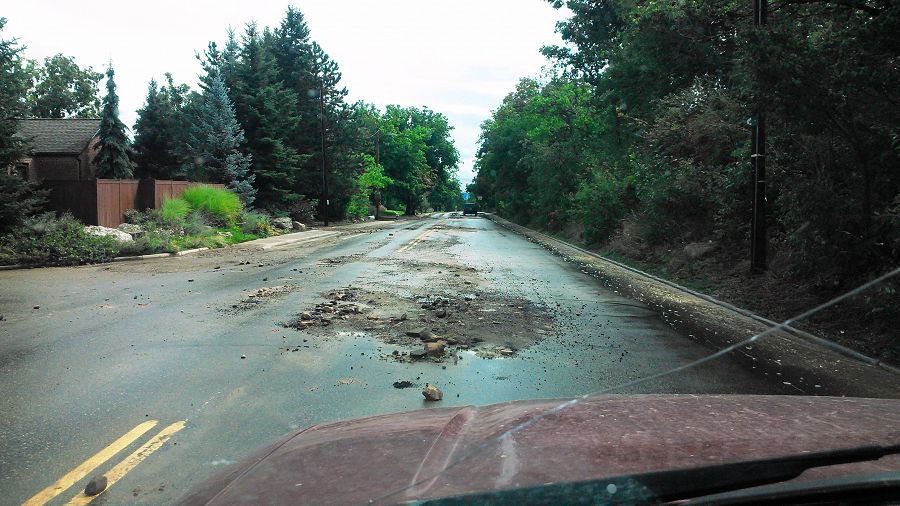
Boulder Flood 2013 (Photo Nate Rock) Debris in road
Boulder Flood 2013 (Photo Nate Rock)
Boulder Flood 2013 (Photo Nate Rock)
Boulder Flood 2013 (Photo Nate Rock)
Boulder Flood 2013 (Photo Nate Rock) Sampling
Boulder Flood 2013 (Photo Nate Rock) Sampling
Boulder Flood 2013 (Photo Nate Rock)
Boulder Flood 2013 (Photo Nate Rock)
Boulder Flood 2013 (Photo Nate Rock)
Boulder Flood 2013 (Photo Nate Rock)
Boulder Flood 2013 (Photo Nate Rock)
Boulder Flood 2013 (Photo Nate Rock)
Boulder Flood 2013 (Photo Nate Rock) Flooded highway
Boulder Flood 2013 (Photo Nate Rock) Flooded highway
Boulder Flood 2013 (Photo Nate Rock) Rescue helicopter
September 12th 2013. Wettest day on record.
Prior to Wednesday, the single wettest day on record was July 31, 1919, when 4.80 inches of rain were recorded, according to Bob Henson, a science writer at the National Center for Atmospheric Research. (Daily Camera POSTED: 09/12/2013 04:54:28 AM MDT)
Sept 17 pictures of Stream gauge at Lower Gordon Gulch added.
Sept 18 pictures of Stream gauge at Lower Gordon Gulch added.
Boulder Creek CZO
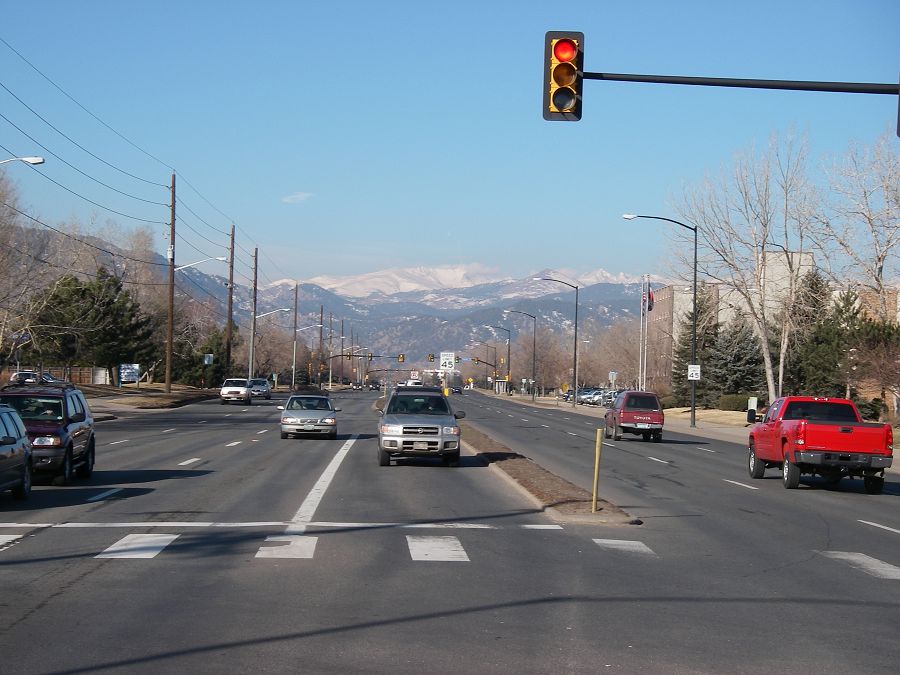
Bloulder Cayon as seen from Arapahoe Road and 30th Street in Boulder colorado
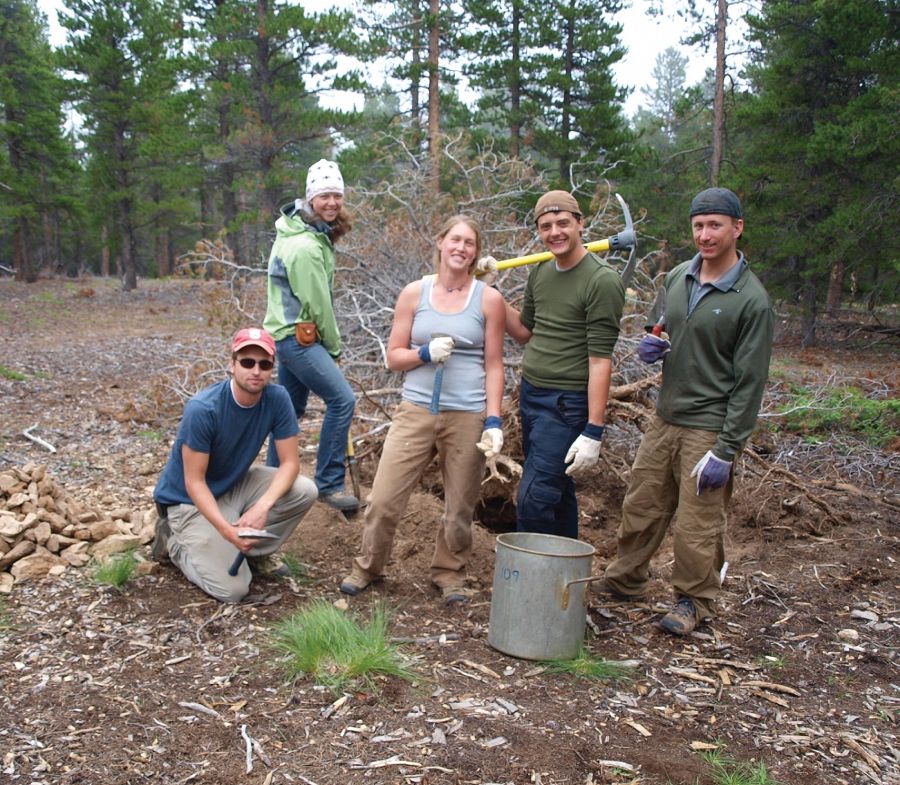
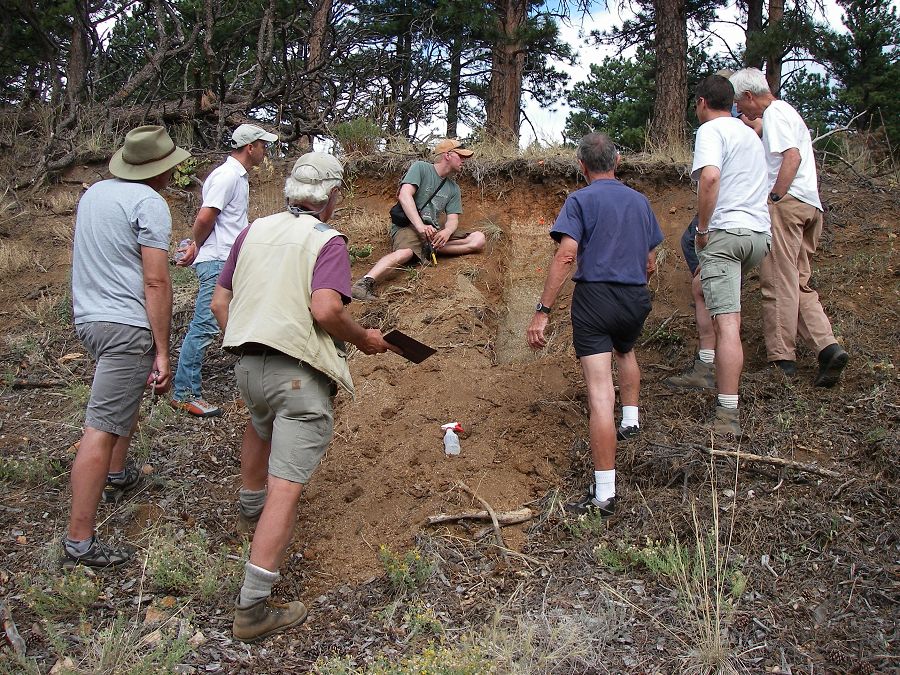
Keck Students
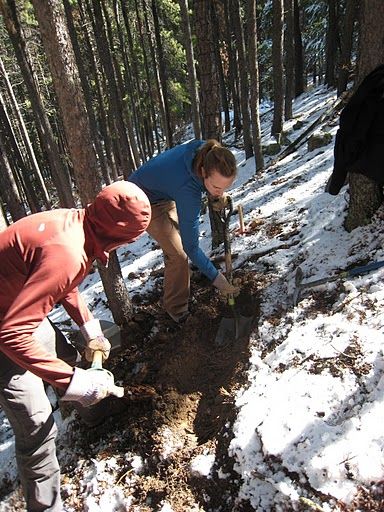
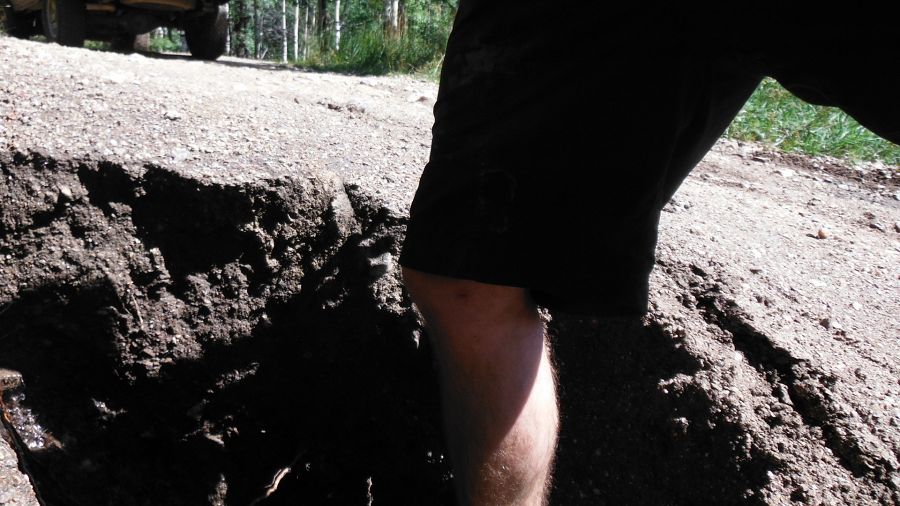
Abby and Daniel digging a trench
Boulder Creek CZO

Students

Outreach
Boulder Creek Critical Zone Observatory
People Involved
CZO
-

Boulder, INVESTIGATOR
-

Boulder, Luquillo, INVESTIGATOR
-

Boulder, INVESTIGATOR
-

Boulder, STAFF
-
Boulder, STAFF
Discipline Tags and CZOs
Geomorphology
Hydrology
Climatology / Meteorology
Outreach / Education Research
National
Boulder
Related News
Colorado’s Extreme Weather Event Smashes Records
26 Sep 2013 - Colorado rainfall records going back to 1893 were shattered by September's intense and persistent rainstorm.
Fresh landslides triggered during September’s deluge
03 Oct 2013 - Heavy Rainfall and the Geomorphic Response During the week of September 9th, 2013, several days of continuous rainfall caused widespread...
Explore Further
