Stream Monitoring During 2014 Hurricane Season in Puerto Rico
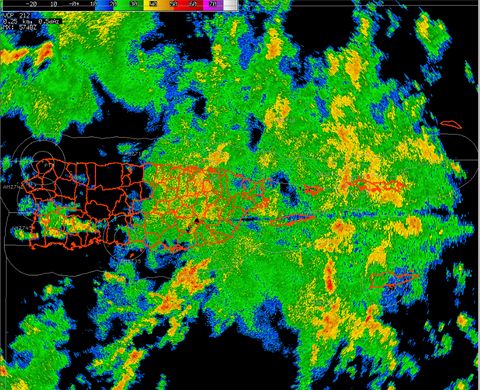
The first tropical system impacted Puerto Rico in 2014 on August 1st when tropical storm Bertha landed amid previously dry conditions. A Tropical Depression then hit on 8-22-14 which later became Hurricane Cristobal and a separate Tropical wave stalled out over Puerto Rico leaving 8 to 9 inches of rain between 8-28-14 and 8-29-14.
https://www.sas.upenn.edu/lczodata/?q=content/el-verde-stream-data
Tropical Depression which became Hurricane Cristobal as it impacts Puerto Rico:
https://twitter.com/NWSSanJuan/status/502850553786171393
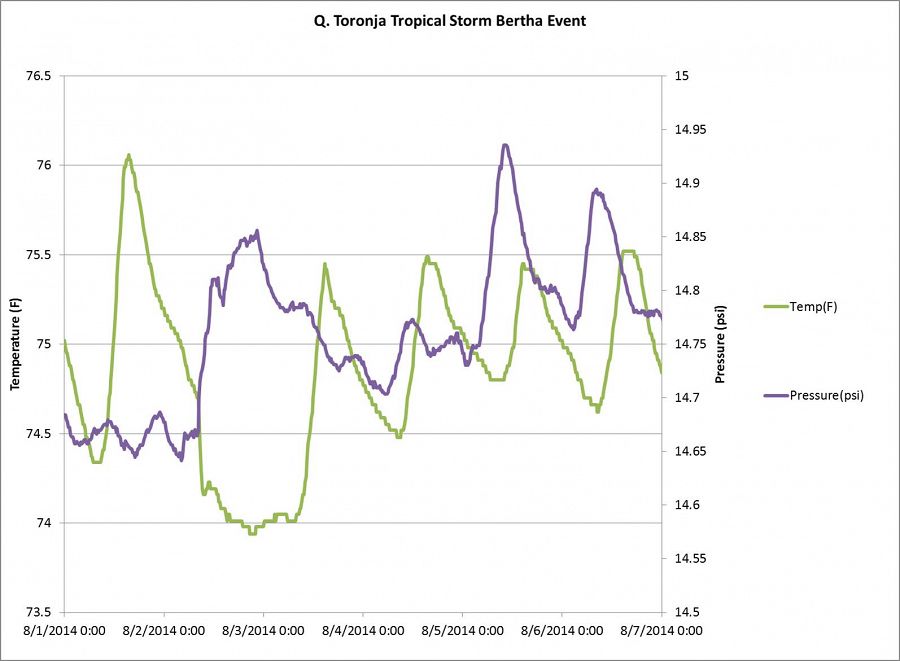
Quebrada Toronja Graph of Water Temperature vs Pressure from Tropical Storm Bertha beginning 8-1-14
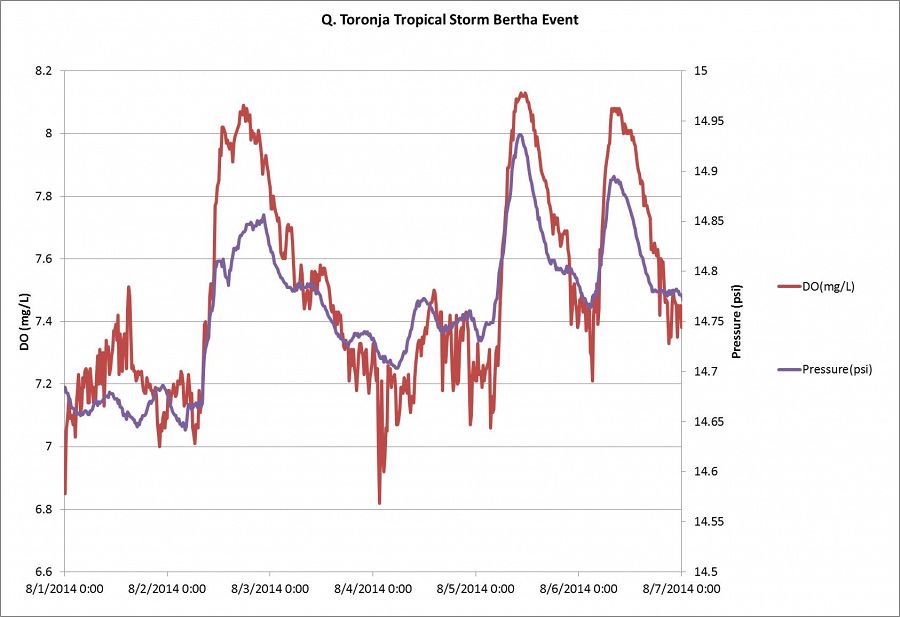
Quebrada Toronja Graph of Dissolved Oxygen vs Pressure from Tropical Storm Bertha beginning 8-1-14
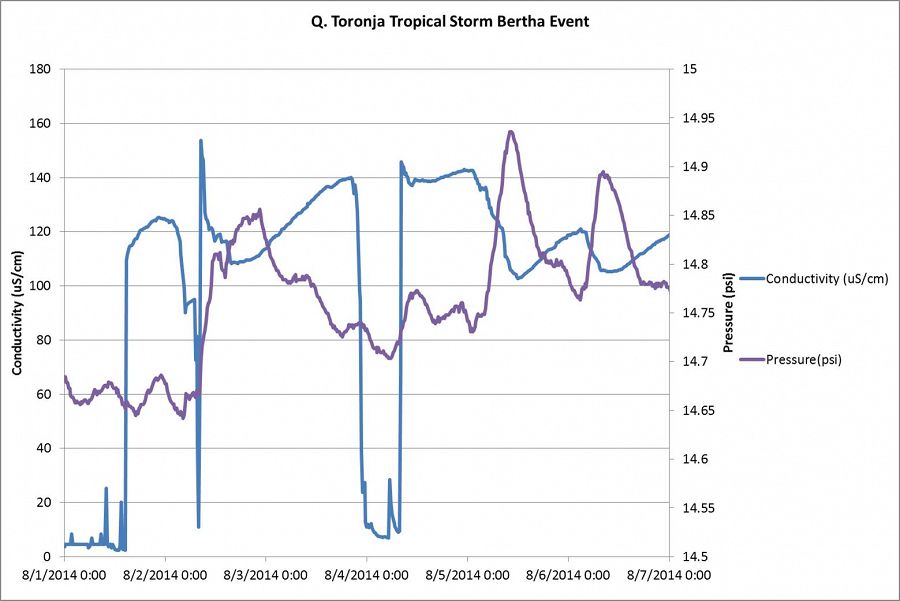
Quebrada Toronja Graph of Conductivity vs Pressure from Tropical Storm Bertha beginning 8-1-14
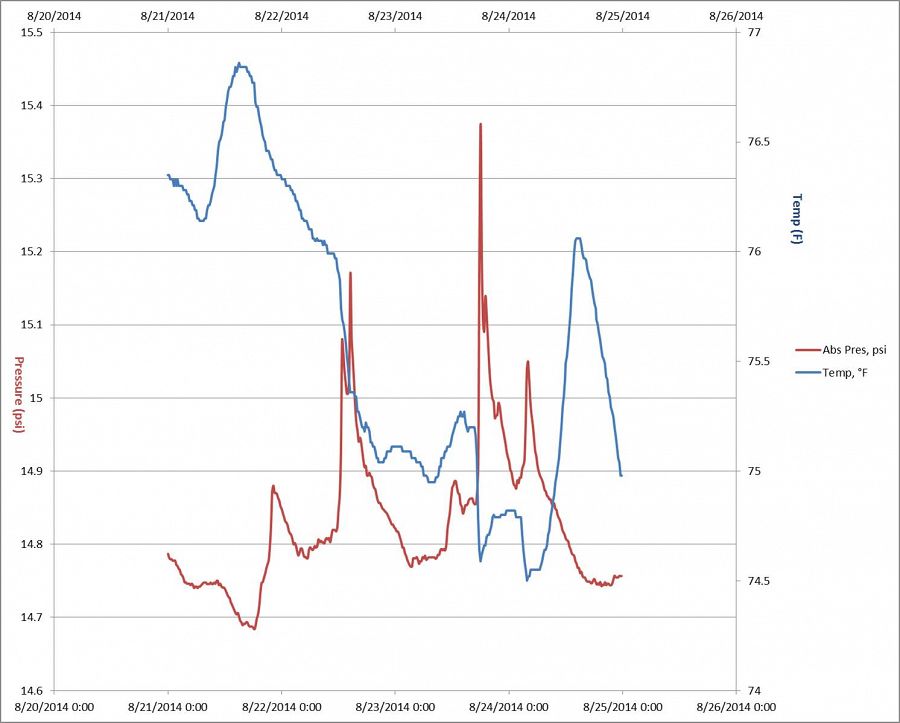
Quebrada Toronja Graph of Water Temperature vs Pressure from Tropical Depression hit Puerto Rico on 8-22-14
Quebrada Toronja Graph of Dissolved Oxygen vs Pressure from Tropical Depression hit Puerto Rico on 8-22-14

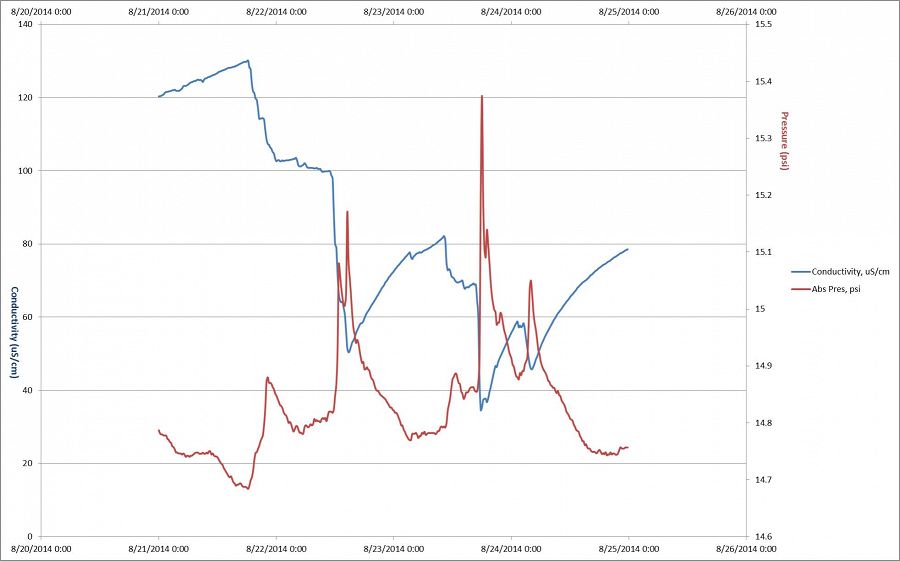
Quebrada Toronja Graph of Conductivity vs Pressure from Tropical Depression hit Puerto Rico on 8-22-14
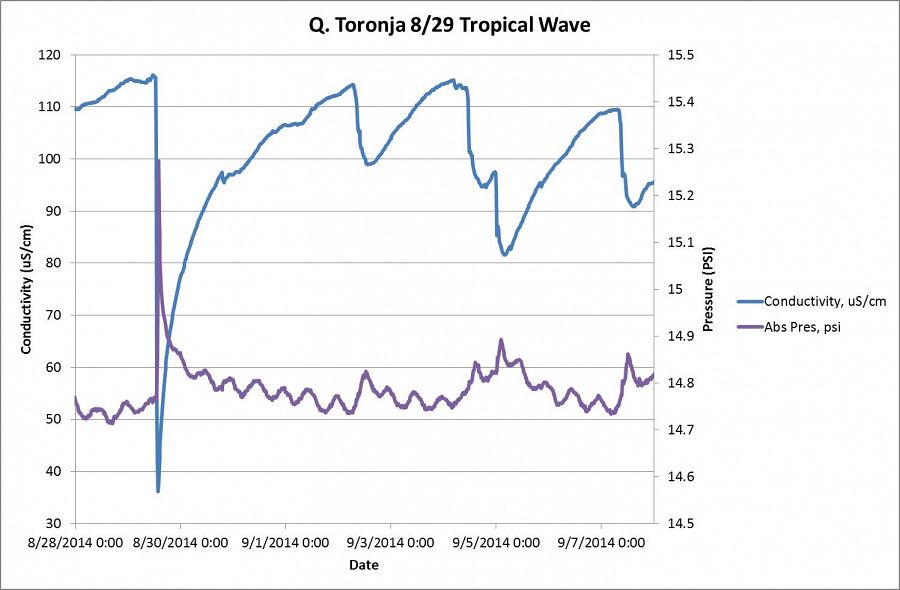
Conductivity vs Pressure in streams measurements on Quebrada Toronja during a tropical wave event 8-29-14 that left 8 to 9 inches of rain near El Verde.
Dissolved Oxygen vs Pressure in streams measurements on Quebrada Toronja during a tropical wave event 8-29-14 that left 8 to 9 inches of rain near El Verde.

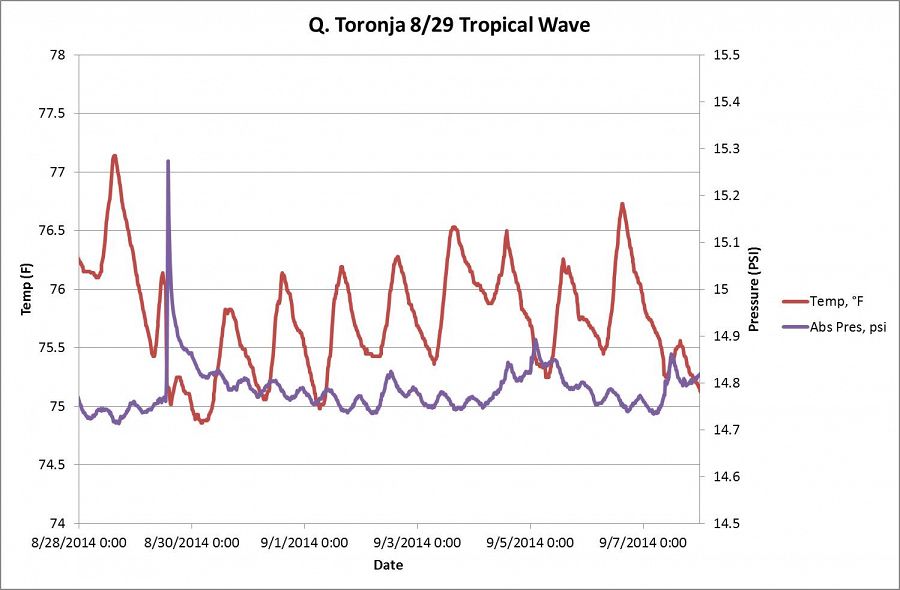
Temperature vs Pressure in streams measurements on Quebrada Toronja during a tropical wave even 8-29-14t that left 8 to 9 inches of rain near El Verde.
Graph of stream data from Tropical wave event
Graph of Conductivity vs Pressure from Tropical Storm Bertha beginning 8-1-14
Graph of Dissolved Oxygen vs Pressure from Tropical Storm Bertha beginning 8-1-14
Graph of Water Temperature vs Pressure from Tropical Storm Bertha beginning 8-1-14
Graph of Conductivity vs Pressure from Tropical Depression hit Puerto Rico on 8-22-14
Graph of Dissolved Oxygen vs Pressure from Tropical Depression hit Puerto Rico on 8-22-14
Graph of Water Temperature vs Pressure from Tropical Depression hit Puerto Rico on 8-22-14
Conductivity vs Pressure in streams measurements on Quebrada Toronja during a tropical wave event 8-29-14 that left 8 to 9 inches of rain near El Verde.
Dissolved Oxygen vs Pressure in streams measurements on Quebrada Toronja during a tropical wave event 8-29-14 that left 8 to 9 inches of rain near El Verde.
Temperature vs Pressure in streams measurements on Quebrada Toronja during a tropical wave even 8-29-14t that left 8 to 9 inches of rain near El Verde.
News Category:
RESEARCH |
INFRASTRUCTURE |
DATA
Explore Further
