GIS & Remote Sensing Research Group
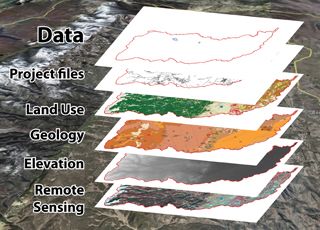
GIS (Geographic Information System) is a system of hardware and software used for storage, retrieval, mapping and analysis of spatial data. GIS maps are made of layers, or collection of geographic objects that are similar. For example, a layer could hold contain cities or streams. To make a GIS map, one could add as many layers as needed. A GIS layer may contain features or surfaces. Features are geographic objects that can be represented by a polygon, line or point. Examples of feature objects are rivers or countries. Some data such as wind speed, temperature, rainfall and ocean depth have no distinct shape. They are measurable values on the earth. Such data are represented by raster, which is a matrix of identically sized square cells. Each cell represents a unit of surface area and contains a measured value for that surface area. A layer composed of raster make up a surface layer.
Image: GIS data layers
This group is tagged with:
-
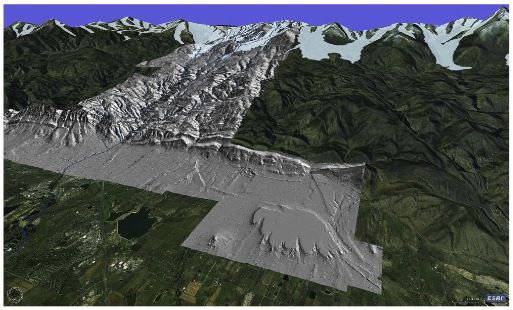
Remote sensing (RS) is a way to gather information about Earth from a distance by using special instruments mounted on airplanes, satellites or even ships. On the surface of the earth, RS instruments measure the radiation reflected and emitted from the Earth at different wavelengths. Under water, RS can map the ocean floor without traveling to the bottom of the ocean using reflected sound waves instead of light waves. Light Detection and Ranging (LIDAR) is a type of remote sensing system used to collect topographic data. LIDAR data are collected with aircraft-mounted lasers capable of recording elevation measurements at a rate of 2000 – 5000 pulses per second. LIDAR is then used to construct a digital elevation model (DEM) which can be applied as a layer in a GIS map. RS imagery is one of the fastest-growing sources for raster GIS data.
BcCZO LiDAR assets consists of Digital Elevation Models (DEM's) and LAS-formated point cloud tiles derived from a snow-on (May, 2010) and snow-off (August, 2010) LiDAR (Light Detection and Ranging) survey inside the Boulder Creek Critical Zone Observatory (CZO), near Boulder Colorado. This data was collected in collaboration between the Boulder Creek CZO and the National Center for Airborne Laser Mapping (NCALM), both funded by the National Science Foundation (NSF). Together, the LiDAR Digital Elevation Models (DEM) and point cloud data will be of interest to land managers, scientists, and others for study of topography, snow, ecosystems and environmental change. The Boulder Creek CZO will be using the LiDAR data to further their mission of focusing on how water, atmosphere, ecosystems, & soils interact and shape the Earth's surface. The "Critical Zone" lies between rock and sky. It is essential to life - including human food production - and helps drive Earth's carbon cycle, climate change, stream runoff, and water quality. These data sets were critical in the analysis of the September 2013 floods and its effects impact on the watershed and the human populations living in it.
At the Boulder Creek CZO, all samples collected have a latitude and longitude. Based on these samples, we can create various layers such as stream discharge, snow survey points and soil samples. Maps, DEMs, attribute data, surface layers and images can be displayed simultaneously and dynamically linked. This can help scientists answer various questions regarding the Boulder Creek CZO, such as:
(1)What controls the spatial variation in a critical zone
(2)How does critical zone development vary across erosional and ecological regmines
(3)How does the distribution of critical zone development control the hydrologic response of the catchment to snow and rainfall.Written by Chi Yang and Eric Parrish
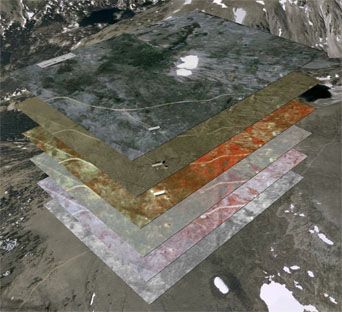
Remote sensing data is very useful for visualization, mapping, analysis, modeling
Example of BcCZO LiDar holdings. LiDAR image of the Colorado Front Range and western High Plains.
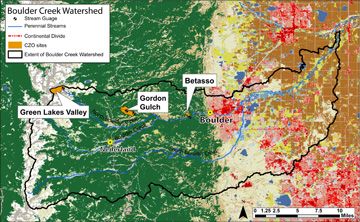
Map of land cover in the Boulder Creek Watershed. (2001 Land Cover from USGS, National Land Cover Database Zone 33 Land Cover Layer)
Remote sensing data is very useful for visualization, mapping, analysis, modeling
Example of BcCZO LiDar holdings. LiDAR image of the Colorado Front Range and western High Plains.
Map of land cover in the Boulder Creek Watershed. (2001 Land Cover from USGS, National Land Cover Database Zone 33 Land Cover Layer)
-
Contacts
-
Boulder, STAFF
1 People
 .(JavaScript must be enabled to view this email address)
INSTAAR
GIS, remote sensing, web development, graphic design, scientific illustration
Alumni-Former

STAFF, Data Manager
.(JavaScript must be enabled to view this email address)
CU-Boulder
Data management
STAFF
.(JavaScript must be enabled to view this email address)
CU-Boulder
Data management, GIS
-
-
Featured Publications
2014
LiDAR-derived snowpack data sets from mixed conifer forests across the Western United States. Harpold, A.A., Q. Guo, N. Molotch, P. D. Brooks, R. Bales, J.C. Fernandez-Diaz, K.N. Musselman, and T.L. Swetnam, P. Kirchner, M. Meadows, J. Flanagan, R. Lucas (2014): Water Resources Research 50(3): 2749-2755
2015
Exhumation by debris flows in the 2013 Colorado Front Range storm. Anderson, S.W., Anderson, S. P., and Anderson, R. S. (2015): Geology, Geological Society of America
2015
Quantifying the effects of vegetation structure on snow accumulation and ablation in mixed-conifer forests. Broxton P. D., Harpold A. A., Biederman J. A., Troch P. A., Molotch N. P., and Brooks P. D. (2015): Ecohydrology 8(6): 1073-1094
2015
The role of precipitation type, intensity, and spatial distribution in source water quality after wildfire. Murphy, S. F., Writer, J. H., McCleskey, R. B., and Martin, D. A. (2015): Environ. Res. Lett. 10 084007
Explore Further
