Geomorphology: Eric Winchell Research Group
Biological agents are ubiquitous within landscapes, and can be observed on daily time scales. Deer-generated game trails and beaver-constructed dams are several examples of the geomorphic impacts of animals. However, despite early interdisciplinary acknowledgement that biology plays a role in landscape evolution (Darwin, 1881; Gilbert, 1909), geomorphologists and biologists have largely worked independently. We honor what is observed to be the primary geomorphic player within the subalpine landscape of the Front Range, the Northern Pocket Gopher, and investigate what drives landscape change.
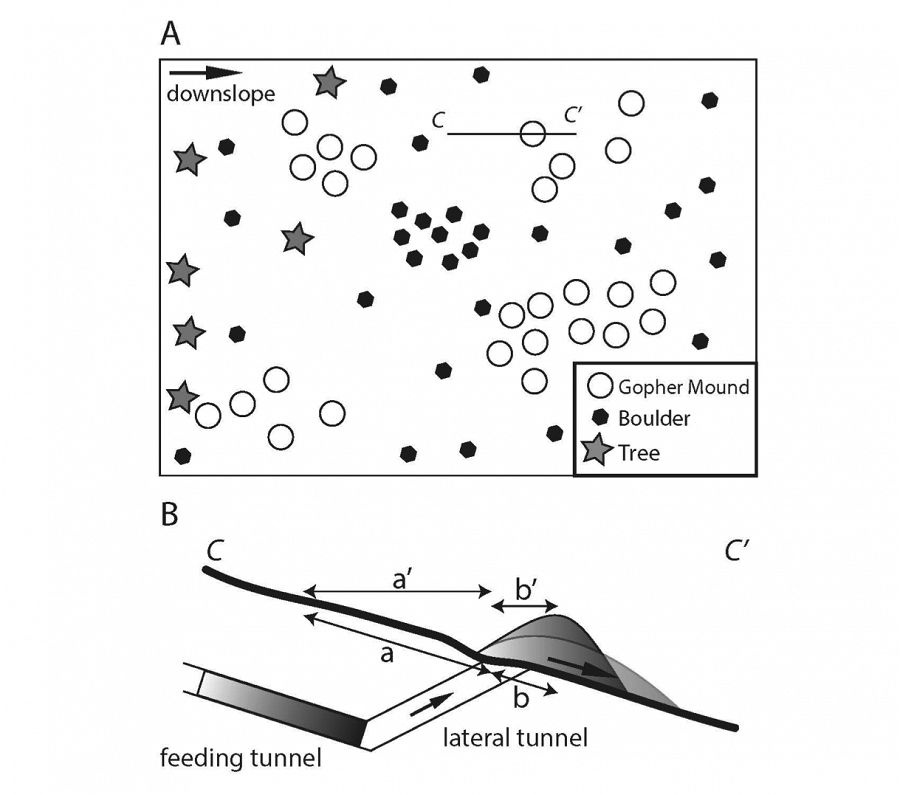
Image: A) The general pattern of gopher activity in the meadow-forest landscape. Gophers inhabit the meadows but not the forests. Gopher mounds develop in a patchy fashion within the meadows, presumably each patch belonging to a solitary gopher. These patches occupy less rocky portions of the glacial till mantled surface. B) Subsurface cross-section (C – C’) of gopher driven sediment transport. Material is transported from the ground-parallel feeding tunnel up through a lateral tunnel where it is deposited on the surface as a mound. Material is then exposed to diffusive transport processes that move material downslope. This sediment transport phenomenon is described by Gabet (2000) as consisting of two discrete horizontal distances: that from the centroid of the tunnel to the burrow exit/entrance (a’), and that from the burrow exit/entrance to the centroid of the mound (b’) as well as two ground-parallel distances consisting of the same endpoints as a’ and b’: a and b.
This group is tagged with:
-
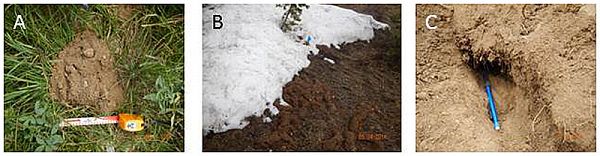
Three primary geomorphic features generated by gophers.
Three primary geomorphic features generated by gophers. A) A surface mound. Surface area and average height of mounds are measured to acquire mound volume; geospatial position was also documented. B) Several infilled tunnels emerging from beneath melting snow cover. Infilled tunnel volumes are calculated by assuming a cylindrical geometry and collecting length and height measurements; we assumed a constant diameter in the horizontal for all infilled tunnels. Geospatial position was also documented. C) A gopher tunnel in which a stone serves as the floor of the tunnel (beneath pencil); this presumably is representative of stones that comprise a large-scale stone line feature reflecting the maximum depth to which gophers have been digging over many generations.
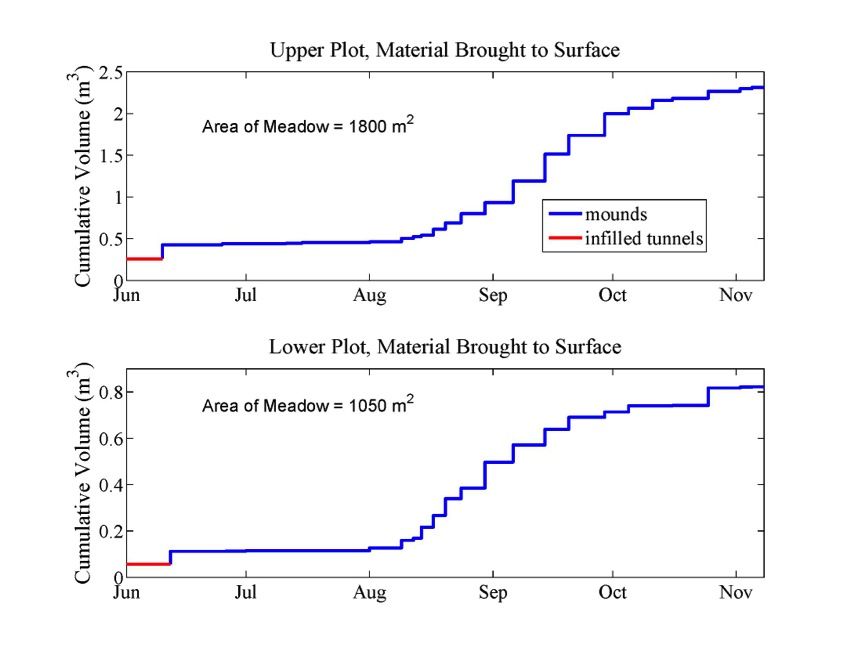
Material to surface
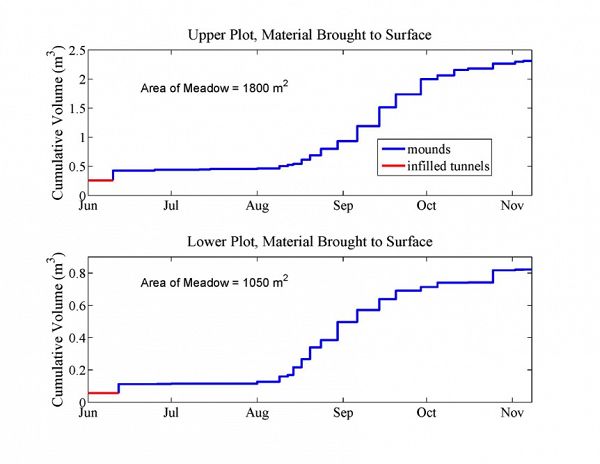
Time series of surficial geomorphic work accomplished by gophers at each site (top panel = upper plot; bottom panel = lower plot). Three distinct patterns of gopher activity appear: (1) infilled tunnels (red) are constructed during the winter and are revealed when the snow retreats in the spring/early summer, (2) gopher mound generation was minor in mid-summer, until (3) mound activity explodes at both sites in early-mid August and then tails off in early-mid October before winter sets in in early November.
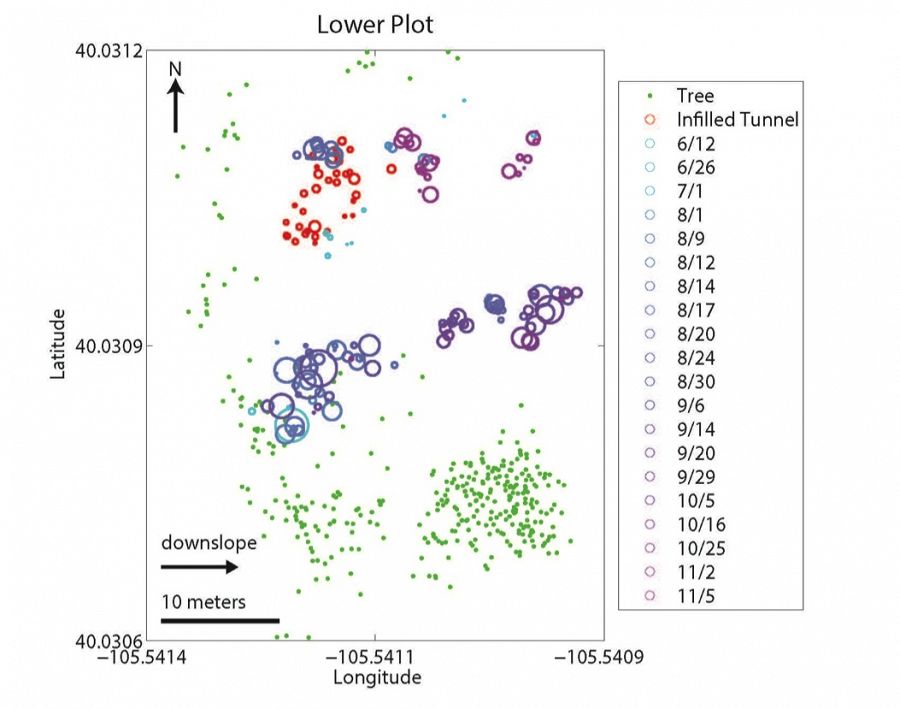
Lower plot

Upper plot
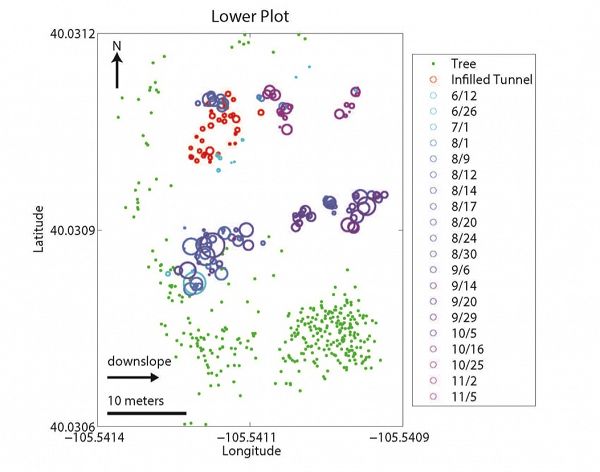
Spatial relationship between mounds (blue/purple circles), infilled tunnels (red circles), and trees (green dots) at upper (top panel) and lower (bottom panel) sites. Landscape slopes downhill to the right in both cases. Infilled tunnel and mound circle sizes are scaled by volume. Dates in the key denote the date when specific mounds were surveyed. If infilled tunnels are proxies for gopher location in the winter, gophers appear to spend the winter months primarily along the upslope, forest-meadow edge. If mounds are proxies for gopher location during all other months, gophers spend these months primarily within the meadow region. We hypothesize that this is driven by the spatial pattern of snow depth which in turn dictates the subsurface temperatures (see last figure).
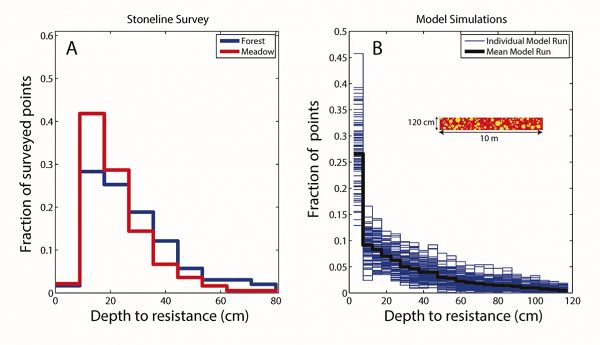
Stoneline survey results
Stoneline survey data for the Upper Site (A) and the mean modeled stoneline survey simulation result for 100 simulations in a randomized glacial till subsurface (B). Highest percentage of depths to refusal in the field was the same in both the forest and meadow regions, implying that a stoneline may be present in both meadow and forest. At the Upper Site, the depth to significant probe resistance in both the meadow and forest regions reveals a median resistance depth of 15 cm within the meadow and 20 cm within the forest. In each model run we emplace around 190 (model run dependent) non-overlapping clasts of a variety of sizes between 0-120 cm depth. The cross-section of the randomized glacial till subsurface for one model run is illustrated in the inset in B. The peak in depths to encountered clasts occurs around 15-20 cm in the field in contrast with the model in which the peak occurs in the top-most bin, 2.5-7.5 cm. The disparity between the data and model results implies that some process has stirred up the subsurface since the glacial till was deposited during the LGM. We hypothesize that the primary process is gopher digging.
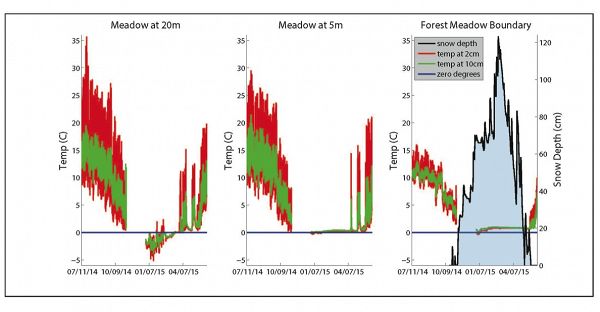
Temperature time series collected at 2 cm (red time series) and 10 cm (green time series) depth at three separate locations: 20 m into the meadow, 5 m into the meadow, and the forest-meadow boundary.
Temperature time series collected at 2 cm (red time series) and 10 cm (green time series) depth at three separate locations: 20 m into the meadow, 5 m into the meadow, and the forest-meadow boundary. Snow depth measured at the forest-meadow boundary is displayed in black on the right panel. During none-snow seasons, these data demonstrate the classic thermal profile in which the temperature is both damped and lagged at depth. At 20 m into the meadow (left panel) the temperature is mostly below freezing (blue line = 0°C) and highly oscillating during the winter, presumably reflecting minimal snow cover. At 5 m into meadow from the upslope, upwind meadow edge (middle panel) mid-winter temperature is more steady and warmer, at ~0°C whereas at the meadow edge (right panel) the temperature is yet warmer at ~1°C during the period of deep snow-cover. Data was not collected in late 2014.
Three primary geomorphic features generated by gophers.
Material to surface
Lower plot
Upper plot
Stoneline survey results
Temperature time series collected at 2 cm (red time series) and 10 cm (green time series) depth at three separate locations: 20 m into the meadow, 5 m into the meadow, and the forest-meadow boundary.
-
Contacts
Alumni-Former
 .(JavaScript must be enabled to view this email address)
Geomorphology


Explore Further
