ARCHIVED CONTENT: In December 2020, the CZO program was succeeded by the Critical Zone Collaborative Network (CZ Net)
×
Using LiDAR to explore the Critical Zone
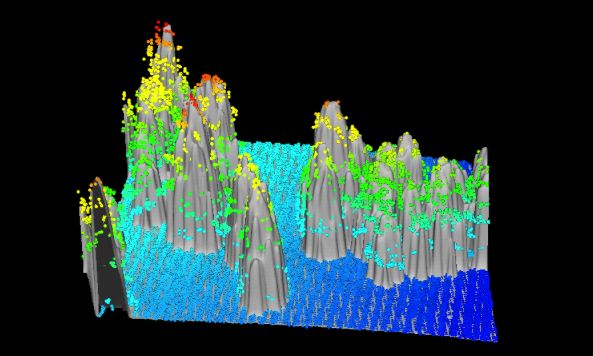
Colorful 3D data visualization comparing LiDAR point cloud data and a canopy model. The data help map the distribution and severity of the Las Conchas forest fire.
Use LiDAR data and display software to analyze the effects of a forest fire in New Mexico. LiDAR is a remote sensing method that uses light in the form of a pulsed laser to measure distances to Earth. It enables the Critical Zone to be explored at fine scales (~1 m) over large areas (>100 km2).
Grades 13 -
16
GIS/RemoteSensing • Biology/Ecology
Computer Activity
Educational Objectives
- Define or describe LiDAR.
- Use LiDAR datasets to compare and contrast landscape appearance before and after a forest fire.
This activity requires a fast PC computer and basic computer skills.
Audience
K-12
Higher Education
Observatory: Catalina-Jemez CZO
Author(s): Adrian Harpold (Univ. of Nevada) and Tim White (Pennsylvania State University)


Funding: NSF CZO
Explore Further
