Fandel et al., 2018
Implicit assumptions of conceptual diagrams in environmental science and best practices for their illustration
Fandel C.A., Breshears D.D., and McMahon E.E. (2018)
Ecosphere 9(1): e02072
-

Catalina-Jemez, INVESTIGATOR
Abstract
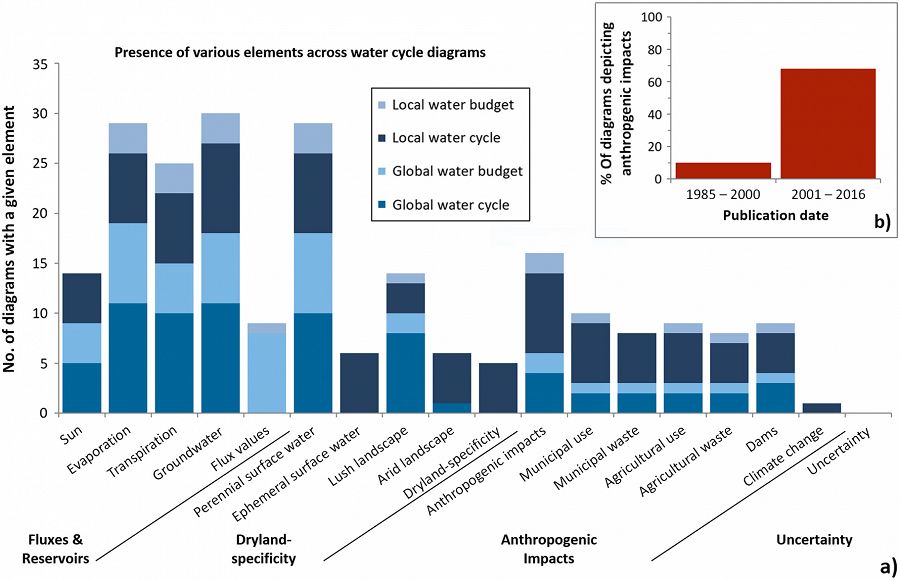
Frequency of appearance of various different elements in a sample of 32 water cycle illustrations. Elements include basic fluxes and reservoirs, anthropogenic impacts, biome specificity, and uncertainty. Only half of the sampled illustrations depicted anthropogenic impacts, but the bulk of those that did were published more recently (see inset b). This suggests that depictions of anthropogenic impacts are more common in newer illustrations. None of the sampled illustrations depicted any form of uncertainty.
In the earth and environmental sciences, many fundamental processes are explained through conceptual illustrations—a powerful medium for scientific communication. The processes depicted are generally highly complex, spatially and temporally variable, subject to high degrees of uncertainty, and non‐linearly impacted by anthropogenic actions. Conceptual illustrations necessarily simplify these processes, but also often suffer from a preventable lack of visual clarity, and/or are based on implicit assumptions that are mismatched to key conclusions in published literature. In this Innovative Viewpoint paper, we highlight considerations of conceptual and visual clarity relevant to illustrations in earth and environmental sciences. Using the water cycle as an example, we examine a range of conceptual illustrations of this process to assess what ideas they convey. An exploratory survey of 32 water cycle diagrams shows that they tend to depict generalized, well‐defined processes. Anthropogenic influences are included and/or implied in only half the diagrams, and none depict uncertainty in any form. The concept of the water cycle conveyed by these diagrams is therefore not quite the same as the concept of the water cycle as understood by hydrologists. This mismatch may negatively impact decision‐making related to water resources management, because the parties involved may unknowingly hold significantly different conceptual models of the processes at work. Other concepts in the earth and environmental sciences may be susceptible to similar issues. Our analysis highlights the importance of carefully assessing the assumptions and simplifying choices inherent in the process of translating a concept into an illustration. We conclude with an example of how these issues can be remedied by presenting a modified water cycle diagram designed to address common misconceptions associated with dryland systems, account for uncertainty in fluxes, and include key anthropogenic effects. A general list of best practices, many of which were used to develop this diagram, is included to help increase awareness among environmental researchers of strategies for increasing the conceptual and visual clarity of illustrations.
Citation
Fandel C.A., Breshears D.D., and McMahon E.E. (2018): Implicit assumptions of conceptual diagrams in environmental science and best practices for their illustration. Ecosphere 9(1): e02072. DOI: 10.1002/ecs2.2072
 This Paper/Book acknowledges NSF CZO grant support.
Explore Further
