Hillslope trajectory
Hillslope trajectory model
Combination of analytical and numerical methods captures soil particle trajectories on a steady state hillslope
Model Category: Numerical
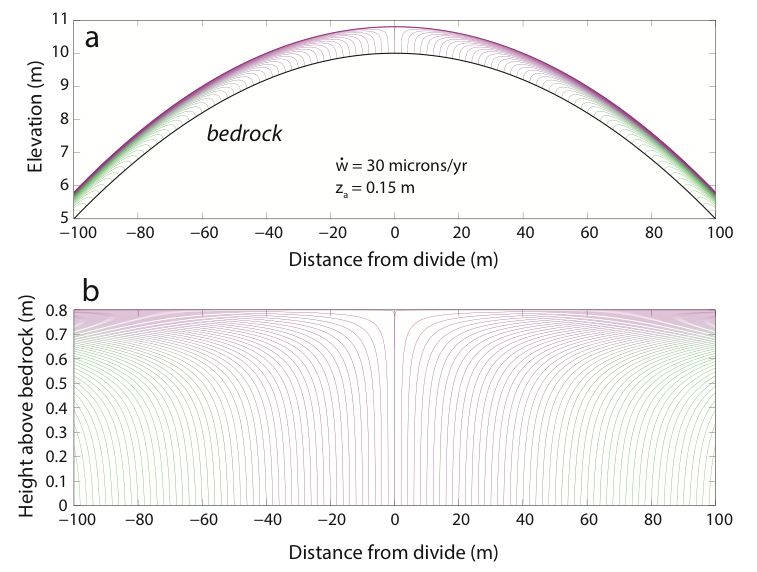
Image: In this figure I show modeled particle trajectories on a steady state hilltop, illustrating a case in which horizontal particle speeds decay exponentially with depth, with a depth scale of za = 0.15 m. a) Shown in landscape position atop a steady state parabolic hilltop. Colors signify location of release from bedrock (purple from hillcrest, green from base of hill). b) Shown in coordinate system of bedrock-soil interface. Note the bunching of trajectories near the surface, and the near-vertical trajectories at depths below the core of the horizontal transport core (>say 2za). In a steady hillslope, this soil would be draped upon a convex, parabolic profile above uniformly lowering weathered rock, as shown in (a). Vertical component of particle speed is constrained to match the lowering rate of the bedrock at the base of the soil, and to diminish to zero at the soil surface. Trajectories therefore become surface-parallel at the top of the soil.
-

Boulder, INVESTIGATOR
Many geomorphic systems act as conveyor belts onto which material is loaded at a particular rate, and is transported in one direction toward another system that serves as a sink. As the material travels, it ages, it changes in grain size, it accumulates cosmogenic radionuclides, it adsorbs or releases nutrients, and it weathers. Here I address the hillslope conveyor. As many geochemical processes are depth-dependent, the depth history of a particle becomes important to know. I calculate soil particle trajectories in the horizontal -depth plane and address three cases, one in which horizontal speeds decline exponentially with depth, a second in which they are uniform with depth, and a third in which horizontal speeds are also uniform but all profile values are vertically well-mixed. Vertical speeds are governed by continuity in an incompressible medium, and by the boundary condition of zero vertical particle speed at the soil surface. Particle trajectories must therefore become surface-parallel at the surface. Knowledge of soil particle trajectories allows calculation of residence times and concentration profiles of 10Be in the soil. The results inform strategies for interpretation of nuclide concentrations in soils and stream sediments, and for inference of transport rate profiles. In all steady cases, the particle age and 10Be structure is uniform with distance from the divide. When significant vertical gradients in horizontal speed occur, the patterns of particle age and of 10Be concentration are dominated by the depth scale of the transport process. In unmixed cases, the particle age and 10Be concentration in near-surface samples can greatly exceed the vertically averaged values, reflecting the fact that the vertical speeds of particles slow dramatically as they near the surface. In cases in which horizontal speed varies significantly with depth, the vertically averaged concentration of 10Be within the soil can significantly under-predict the mean 10Be concentration of sediment delivered to the channel. Proper averaging requires weighting by particle speed. These results provide the backdrop for addressing chemical evolution of soil on a hillslope.
From Figure 4 in Anderson (2015) Particle trajectories on hillslopes: Implications for particle age and 10Be structure
Modeling particle trajectories on a hillslope. A parabolic steady state hilltop is shown with its soil in motion away from the divide. In steady state form, two interfaces must lower at uniform and identical rates: the topographic surface, and the base of the soil. Particles are shown as black dots until they are released into the soil, after which they change in color according to how much time they have spent in the soil (going from blue to yellow as they age). “Old” particles are always on the surface. Example shown here assumes an exponential decrease of particle speed with depth. Particle speeds also increase away from divide to accomplish the linear increase in soil flux required at steady state.
Reference: Anderson, R.S., 2015, Particle trajectories on hillslopes: Implications for particle age and 10Be structure, JGR-Earth Surface, doi: 10.1002/2015JF003479
Model of hillslope soil creep associated with freezing and thawing of the soil (termed frost creep). Each new red-black pair of profiles represents a frost event, red being the frozen state in which ice lenses have formed resulting in a slope-normal expansion of the soil, and black is the thawed state resulting in vertical collapse of the profile due to melting of the ice lenses. The depth of frost penetration into the soil is chosen from a random distribution of depths. The resulting profile of soil displacement and hence soil velocity declines nonlinearly with depth. Analytic solutions for these profiles can be used to calculate the downslope soil discharge on a given slope given the distribution of frost event depths and soil strain associated with freezing.
References:
Anderson, R. S. (2002): Modeling of tor-dotted crests, bedrock edges and parabolic profiles of the high alpine surfaces of the Wind River Range, Wyoming. Geomorphology 46: 35-58
Anderson, R. S., S. P. Anderson, and G. Tucker (2013): Rock damage and regolith transport by frost: An example of climate modulation of critical zone geomorphology, ESPL 38, 299-316, doi: 10.1002/esp.3330 (published online 18 Oct 2012)
Rock is damaged by frost cracking (yellow high damage, red low damage), making the rock increasingly susceptible to release into the mobile regolith (soil) layer. Mobile regolith thickness is shown on bottom panel. Soil transport is governed by frost creep. As both frost cracking and frost creep are dependent upon the thermal state of the landscape, aspect and climate matter. Equator-facing slope (hence south-facing in the northern hemisphere) is to the left. Oscillations in form reflect climate variations dominated by the 40,000 year cycle.
Reference:
Anderson, R. S., S. P. Anderson, and G. Tucker (2013): Rock damage and regolith transport by frost: An example of climate modulation of critical zone geomorphology, ESPL 38, 299-316, doi: 10.1002/esp.3330 (published online 18 Oct 2012)
Publications
2015
Particle trajectories on hillslopes: Implications for particle age and 10Be structure. Anderson, R.S. (2015): JGR-Earth Surface 120: 1626–1644
Explore Further
