Goulden et al., 2012
Evapotranspiration along an elevation gradient in the Sierra Nevada.
Goulden, M.L., Anderson, R.G., Bales, R.C., Kelly, A.E., Meadows, M., and Winston, G.C. (2012)
Journal of Geophysical Research 117 (G3).
-
Sierra, INVESTIGATOR
-
Sierra, GRAD STUDENT
-

Sierra, INVESTIGATOR
-
Sierra, GRAD STUDENT
-

Sierra, STAFF
Abstract
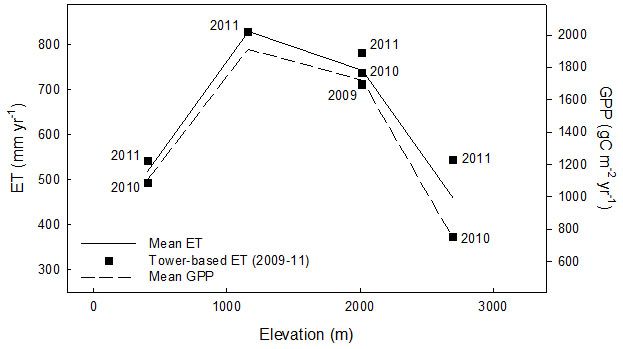
Relationships between elevation, Evapotranspiration (ET; mm y-1; filled squares; annotated with water year of measurement), and Gross Ecosystem CO2 Exchange (GEE; gC m-2 y-1; positive fluxes indicate CO2 uptake by the land surface) determined by annually summed eddy covariance. For information of flux towers, see infrastructure page.
We combined observations from four eddy covariance towers with remote sensing to better understand the altitudinal patterns of climate, plant phenology, Gross Ecosystem CO2 Uptake, and Evapotranspiration (ET) around the Upper Kings River basin in the southern Sierra Nevada Mountains. Precipitation (P) increased with elevation to ∼500 m, and more gradually at higher elevations, while vegetation graded from savanna at 405 m to evergreen oak and pine forest to mid-montane forest to subalpine forest at 2700 m. CO2 uptake and transpiration at 405 m peaked in spring (March to May) and declined in summer; gas exchange at 1160 and 2015 m continued year-round; gas exchange at 2700 m peaked in summer and ceased in winter. A phenological threshold occurred between 2015 and 2700 m, associated with the development of winter dormancy. Annual ET and Gross Primary Production were greatest at 1160 and 2015 m and reduced at 405 m coincident with less P, and at 2700 m coincident with colder temperatures. The large decline in ET above 2015 m raises the possibility that an upslope redistribution of vegetation with climate change could cause a large increase in upper elevation ET. We extrapolated ET to the entire basin using remote sensing. The 2003–11 P for the entire Upper Kings River basin was 984 mm y−1 and the ET was 429 mm y−1, yielding a P-ET of 554 mm y−1, which agrees well with the observed Kings River flow of 563 mm y−1. ET averaged across the entire basin was nearly constant from year to year.
Citation
Goulden, M.L., Anderson, R.G., Bales, R.C., Kelly, A.E., Meadows, M., and Winston, G.C. (2012): Evapotranspiration along an elevation gradient in the Sierra Nevada . Journal of Geophysical Research 117 (G3).. DOI: 10.1029/2012JG002027
 This Paper/Book acknowledges NSF CZO grant support.
Explore Further
