Processes
Conceptual model processes and implications
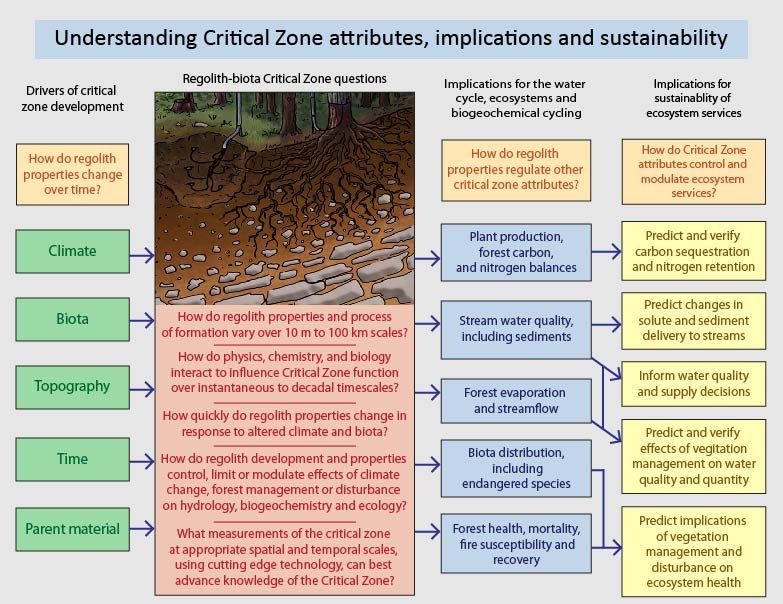
Drivers of critical zone development must be understood together to address science questions and understand implications
Model Category: Conceptual
Image: Flow diagram of Critical Zone, extending from drivers of processes, to broader questions, to implications and sustainability
This figure introduces the conceptual model in words, identifying drivers of critical zone processes, overarching questions, implications for how critical zone properties and processes control societally important attributes, and the implications for ecosystem services and sustainability of teh critical zone for supporting life.
The framework outlined in the two matrices that follow provides a conceptual context for our measurements and modeling, which we use to characterize flux gradients at all scales. It also helps us explore cross-scale and cross-process interactions, such as whether differences in bedrock geochemistry determine whether soil is present or absent, thus influencing ET patterns at watershed scales. If this is the case bedrock geochemistry may ultimately regulate the sensitivity of watershed ET to climate change, with implications for predicting stream flow in the future.
We note that the ecologic, climatic and geologic factors in the matrices below influence the fluxes and stores of material, water, and energy and their gradients across landscapes or plots and how those gradients change through time. The dominant control (e.g., geologic versus climatic) however may be different for different fluxes and stores. We also distinguish between water fluxes associated with the near surface (rooting zone to atmosphere) and deeper groundwater fluxes.
Explore Further
