ARCHIVED CONTENT: In December 2020, the CZO program was succeeded by the Critical Zone Collaborative Network (CZ Net) ×

hsB-SM

Jump to Description ▼

Schematic representation of dominant processes included in hsB-SM.

Semi-Distributed Hydrologic Model

Semi-distributed hydrological model called hsB-SM (hillslope storage Boussinesq-Soil Moisture)

Model Category: Conceptual | Numerical

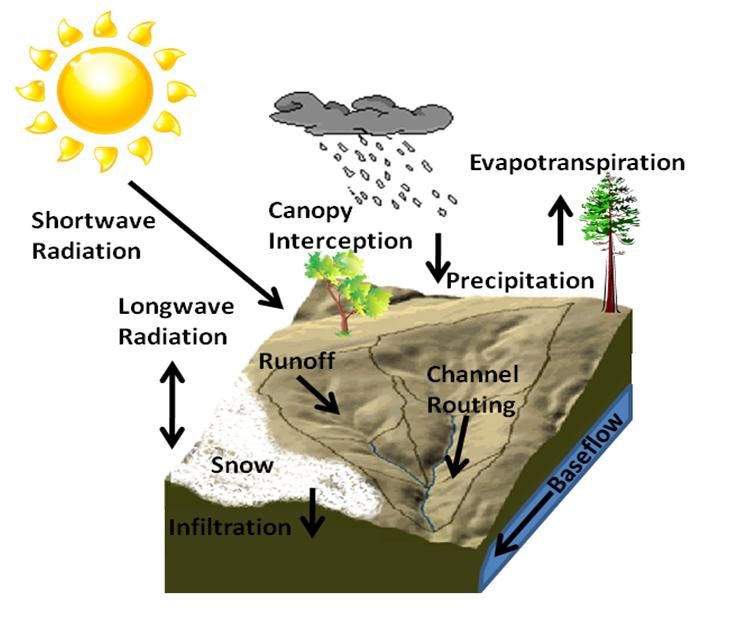
Image: Schematic representation of dominant processes included in hsB-SM.


Observed (solid line) versus simulated (dashed line) flow duration curves for 12 catchments across a climate gradient (1990-1999). The inset shows the Nash-Sutcliffe efficiency (NSE), the Nash-Sutcliffe efficiency after log-transforming streamflow (NSE-Log) and the mean absolute error between observed and modeled ordinates of the FDC (Mean AE; in mm/d) (Carrillo et al., 2011).

The Surface Water Hydrology group in the Department of Hydrology and Water Resources has developed a semi-distributed hydrological model called hsB-SM (hillslope storage Boussinesq-Soil Moisture). The model is based on the following principles: (1) the model should be process-based such that we can use it to analyze catchment behavior derived from routine hydro-meteorological observations at the catchment scale, such as daily discharge, temperature and precipitation; (2) the model should be as parsimonious as possible to avoid problems of over-parameterization and equifinality and reduce computer processing time; and (3) the model should be applicable to a wide range of catchments across climate and physiographic gradients. In order to represent the dominant functions of a catchment we consider hillslopes and channel network as fundamental landscape units (Troch et al., 2003). Hillslope land surfaces interact with the atmosphere and partition water and energy fluxes, and drain surface runoff and subsurface flow into the catchment channel network for routing towards the outlet (i.e. point where discharge is measured). Instead of representing individual hillslopes and how they are connected to the channel network, we adopt the modeling approach of Troch et al. (1994) and use the hillslope width function and the channel width function at the catchment scale to represent the geomorphologic structure of the catchment. Each catchment is thus characterized by a hillslope width function (probability density function of water entering the catchment at a given flow distance from the channel network) and a channel width function (probability density function of surface and subsurface flow entering the channel network at a given flow distance from the outlet) that are derived from available digital elevation models (DEMs). Important additional terrain properties such as average hillslope/channel slope are also estimated from available DEMs. Other landscape properties, such as land use-land cover and soils, available from various spatial databases are further used to assign initial values to process parameters that control the different catchment functions, such as infiltration and interception.

Required model forcing variables are precipitation, air temperature, downward short- and longwave radiation, relative humidity, atmospheric pressure and wind speed. Other required model inputs include time evolution of catchment-wide leaf area index (LAI) and albedo.

References

Carrillo, G., P.A. Troch, M. Sivapalan, T. Wagener and K. Sawicz: Catchment Classification: Hydrological Analysis of Catchment Behavior through Process-based Modeling along a Climate Gradient, HESS, 15, 3411-3430, doi:10.5194/hess-15-3411-2011, 2011.

Troch, P. A., Paniconi, C., and van Loon, E. E.: The hillslope-storage Boussinesq model for subsurface flow and variable source areas along complex hillslopes: 1. Formulation and characteristic response, Water Resour. Res., 39(11), 1316, doi:10.1029/2002WR001728, 2003.

Troch, P. A., Smith, J. A., Wood, E. F., and de Troch F. P.: Hydrologic controls of large floods in a small basin: central Appalachian case study, J. Hydrol., 156, 285-309, 1994.

Observed (solid line) versus simulated (dashed line) flow duration curves for 12 catchments across a climate gradient (1990-1999). The inset shows the Nash-Sutcliffe efficiency (NSE), the Nash-Sutcliffe efficiency after log-transforming streamflow (NSE-Log) and the mean absolute error between observed and modeled ordinates of the FDC (Mean AE; in mm/d) (Carrillo et al., 2011).