Mobley et al., 2019
How to estimate statistically detectable trends in a time series: A study of soil carbon and nutrient concentrations at the Calhoun LTSE
Mobley, M.L., Y. Yang, R.D. Yanai, K.A. Nelson, A.R. Bacon, P.R. Heine, and D.D. Richter (2019)
Soil Science Society of America Journal 83(s1): S133-S140
-

Calhoun, COLLABORATOR
-

Calhoun, INVESTIGATOR
-

Calhoun, STAFF
-

Calhoun, INVESTIGATOR
Abstract
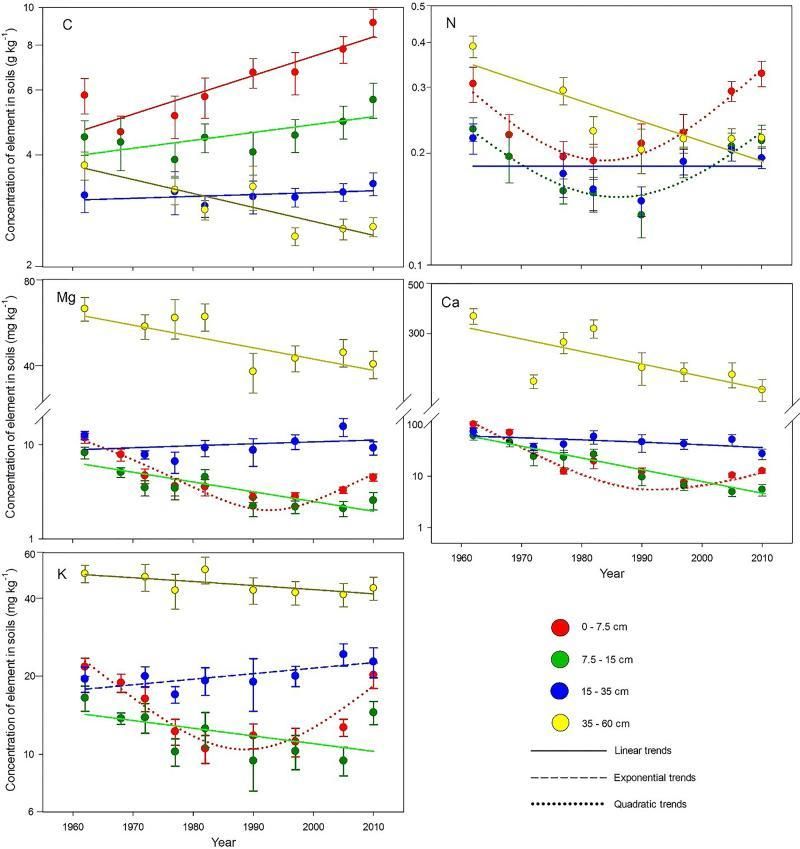
Best fit regression models, selected by AICc, to describe changes from 1962 to 2010 in concentrations of five elements (total C and N, and exchangeable Mg, Ca, and K), plotted on logarithmic scale at four soil depths (denoted by different colors) at the Calhoun LTSE. Solid, dashed, and dotted lines indicate linear, exponential, and quadratic model trends, respectively.
Quantifying rates of change in soil carbon and nutrients is essential to understanding the global carbon cycle as well as to guiding local management decisions. However, change in soils can be nonlinear, difficult to detect, and dependent on the depth of soil examined. The purpose of this study was to demonstrate how to quantify uncertainty in detection of soil change, which has major implications for the design of soil monitoring projects. We analyzed soils collected over five decades from a long-term soil-ecosystem experiment in the South Carolina Piedmont of the United States. We estimated the minimum detectable change (MDC) using a dataset of soil carbon, nitrogen, calcium, magnesium, and potassium concentrations at four soil depths (0–7.5, 7.5–15, 15–35, and 35–60 cm). Changes over time in the log-transformed concentration at each soil depth were fit with one of three response shapes (linear, exponential, and quadratic) with the best model fit determined by a corrected AIC. The MDC analyses were conducted using repeated-measures models. For soil depths in which elemental change was quadratic, we conducted MDC analyses separately on the decreasing and increasing limbs. We also used paired t tests to analyze the MDCs based on only the first and last sample dates. Greater sampling intensity was needed to detect equivalent proportional changes in elements at intermediate depths than at shallower or deeper depths. Our study demonstrates the importance of considering the pattern and rate of the expected change, and how that may vary by element and depth, when designing and evaluating soil monitoring studies.
Citation
Mobley, M.L., Y. Yang, R.D. Yanai, K.A. Nelson, A.R. Bacon, P.R. Heine, and D.D. Richter (2019): How to estimate statistically detectable trends in a time series: A study of soil carbon and nutrient concentrations at the Calhoun LTSE. Soil Science Society of America Journal 83(s1): S133-S140. DOI: 10.2136/sssaj2018.09.0335
 This Paper/Book acknowledges NSF CZO grant support.
Explore Further
