Susquehanna Shale Hills CZO hosts Dorothy Merritts for All Hands 2015

The annual SSHCZO All Hands meeting featured Dr. Dorothy Merritts, Harry W. and Mary B. Huffnagle Professor of Geosciences and Chair of the Department of Earth and Environment at Franklin and Marshall College, as invited guest. In addition to visiting the CZO catenas in Shale Hills and Garner Run, Merritts presented the opening seminar “Lidar and Field Analysis of Periglacial Landforms and their Paleoclimatic Significance, Unglaciated Pennsylvania.”
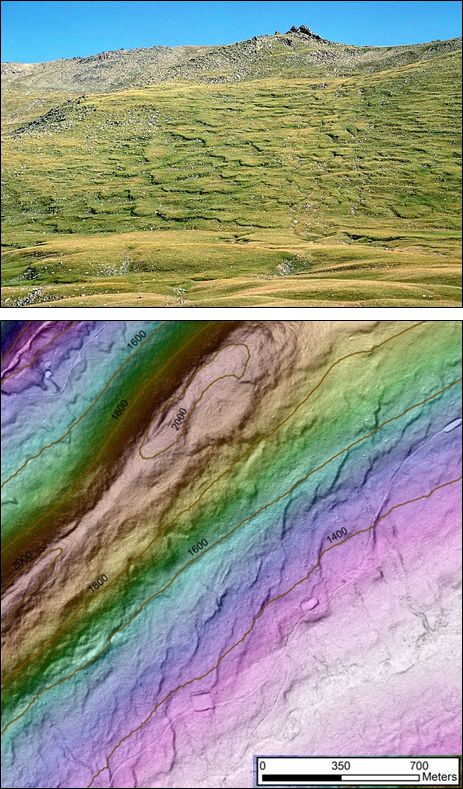
(Top): Gelifluction lobes and sheets along the slopes of the Tien Shan Mountains, Kyrgyzstan. Note that lobes widen downslope, becoming sheets, and in the valley bottom become much broader sheets with thermokarst features. Photographer and copyright: Marli Miller, University of Oregon (http://marlimillerphoto.com/). (Bottom) Lidar-derived (LAS files) slopeshade on color-shaded DEM showing solifluction lobes and sheets along the north- and south-facing slopes of Nittany Mountain, approximately 40 km south of the LGM maximum ice limit, near Madisonburg, central Pennsylvania. Lobes are better developed on the south-facing slope, and become longer and wider downslope. On the south-facing slope, lobes become sheets that trend become oriented obliquely with respect to slope. At this location, Nittany Mountain is the northern limb of a syncline. Sandstone dipping south along the ridge crest is the Silurian Tuscarora Formation; mid-slopes and valley bottom are Silurian Clinton Group (sandstone and shale). Lobes along mid-slope contain Tuscarora sandstone from the ridge crest area.
We have identified the following evidence of permafrost throughout Pennsylvania, at all altitudes: 1) extensive networks of thermal contraction polygons on shale hills and side slopes; 2) thick, ubiquitous gelifluction sheets and lobes on quartzite, sandstone, and diabase ridges and side slopes (continuing downslope over shale benches at many locations); and 3) several pingos in valley bottoms. In addition to these landforms, we document two others—retrogressive thaw slumps and thermokarst gullies--that are common in regions of permafrost thaw today. Our radiocarbon dating, combined with paleoseed analysis, indicates that valley bottom wetlands became established on periglacial rubble (including extensive, low-gradient colluvial debris aprons and tributary fans) and thermokarst features after permafrost thaw during the late Pleistocene, and that in many locations these wetlands persisted throughout the Holocene until European settlement. Wetland (hydric) soils are still preserved at numerous locations where buried beneath historic sediment that was shed from hillslopes and trapped in valley bottoms as a result of land clearing, farming, and mill damming that began in the 1700s.
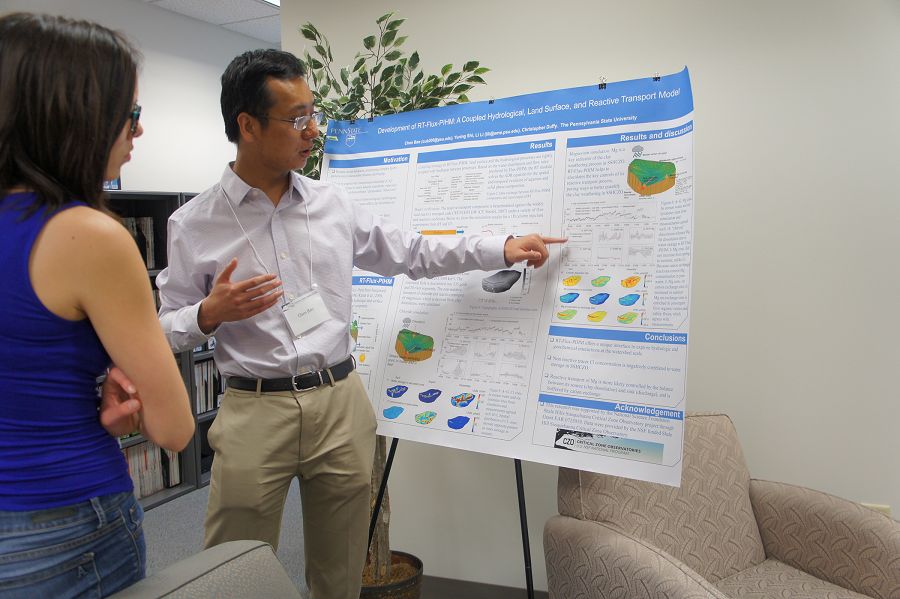
Chen Bao, PhD Candidate Petroleum and Natural Gas Engineering, discusses the finer points of RT-Flux-PIHM model.
Chen Bao, PhD Candidate Petroleum and Natural Gas Engineering, discusses the finer points of RT-Flux-PIHM model.
(Top): Gelifluction lobes and sheets along the slopes of the Tien Shan Mountains, Kyrgyzstan. Note that lobes widen downslope, becoming sheets, and in the valley bottom become much broader sheets with thermokarst features. Photographer and copyright: Marli Miller, University of Oregon (http://marlimillerphoto.com/). (Bottom) Lidar-derived (LAS files) slopeshade on color-shaded DEM showing solifluction lobes and sheets along the north- and south-facing slopes of Nittany Mountain, approximately 40 km south of the LGM maximum ice limit, near Madisonburg, central Pennsylvania. Lobes are better developed on the south-facing slope, and become longer and wider downslope. On the south-facing slope, lobes become sheets that trend become oriented obliquely with respect to slope. At this location, Nittany Mountain is the northern limb of a syncline. Sandstone dipping south along the ridge crest is the Silurian Tuscarora Formation; mid-slopes and valley bottom are Silurian Clinton Group (sandstone and shale). Lobes along mid-slope contain Tuscarora sandstone from the ridge crest area.
News Category:
RESEARCH
People Involved
CZO
-

Shale Hills, GRAD STUDENT
-

Shale Hills, GRAD STUDENT
-

Shale Hills, GRAD STUDENT
-

Shale Hills, GRAD STUDENT
-

Shale Hills, GRAD STUDENT
-

Shale Hills, GRAD STUDENT
-

Calhoun, Christina, Shale Hills, COLLABORATOR
-

Shale Hills, INVESTIGATOR, COLLABORATOR
-

National, Eel, Luquillo, Shale Hills, INVESTIGATOR, COLLABORATOR
-

Shale Hills, INVESTIGATOR
-

Shale Hills, INVESTIGATOR
-

Shale Hills, INVESTIGATOR
-

Shale Hills, INVESTIGATOR
-

Shale Hills, INVESTIGATOR
-

Shale Hills, INVESTIGATOR
-

Shale Hills, INVESTIGATOR
-

IML, Shale Hills, INVESTIGATOR
-

Shale Hills, INVESTIGATOR
-

Shale Hills, INVESTIGATOR
Explore Further
