Dralle et al., 2014
Spatially variable water table recharge and the hillslope hydrologic response: Analytical solutions to the linearized hillslope Boussinesq equation
Dralle, D.N. Boisramé, G., and Thompson, S. E. (2014)
Water Resources Research 50:8515-8530.
-

Eel, INVESTIGATOR, COLLABORATOR
-

Eel, INVESTIGATOR
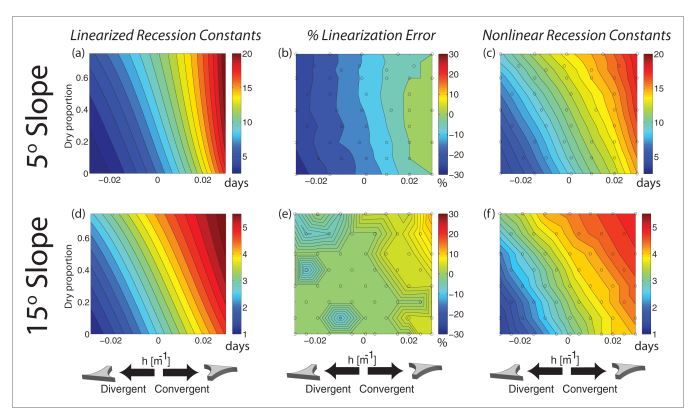
Contour plots of recession constants for (a, d) the linearized HSB simulations and(c, f) the nonlinear HSB for varying recharge distributions and hillslope geometries (calculated using Table 4 with td = 1000 days, γ = 0, α = 0). Circles on the contour plot indicate the parameter combinations for which the nonlinear HSB was numerically solved. The vertical axis in Figures 7a, 7c, 7d, and 7f indicates the downslope proportion (by area) of the hillslope that receives no recharge. The horizontal axis indicates the strength of hillslope convergence or divergence, as measured by the parameter h in the hillslope width function (w). The illustrated hillslopes on the horizontal axis correspond in scale to approximately h = 0.02 (convergent) and inline image (divergent). The recharge rate on homogeneously recharged hillslopes (dry proportion inline image) is 10 mm/d and the slope length Bx = 100 m. Figures 7b and 7e contour the percent error of the recession constant computed by the linearized HSB against the recession constant computed by the nonlinear HSB.
Citation
Dralle, D.N. Boisramé, G., and Thompson, S. E. (2014): Spatially variable water table recharge and the hillslope hydrologic response: Analytical solutions to the linearized hillslope Boussinesq equation. Water Resources Research 50:8515-8530. .
 This Paper/Book acknowledges NSF CZO grant support.
Explore Further
