Bonetti et al., 2019
The effect of accelerated soil erosion on hillslope morphology
Bonetti, Sara, Daniel D. Richter, Amilcare Porporato (2019)
Earth Surface Processes and Landforms 44(15): 3007-3019
-

Calhoun, GRAD STUDENT
-

Calhoun, INVESTIGATOR
-

Calhoun, INVESTIGATOR
Abstract
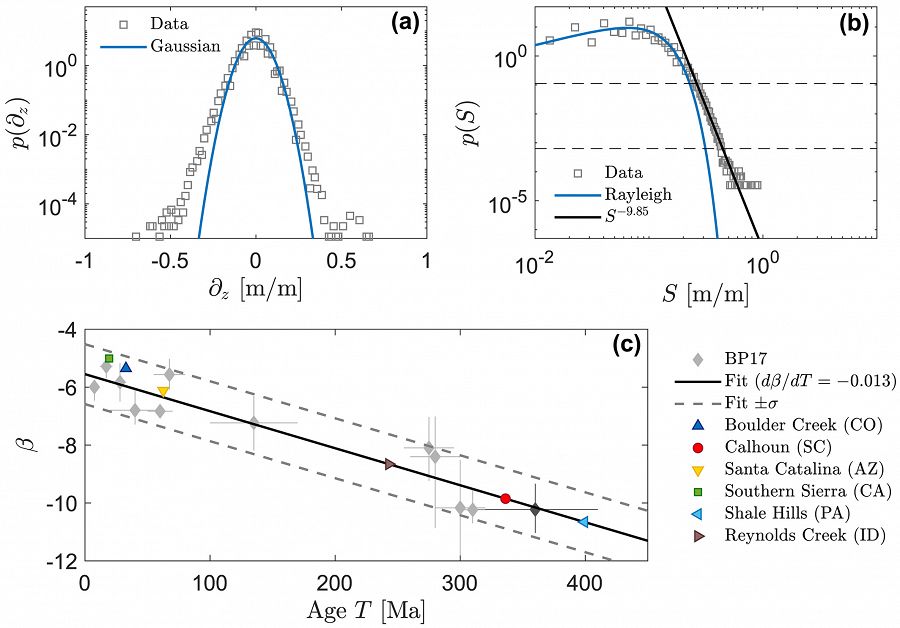
Figure 2: (a) Gradient (∂z) and (b) slope (S) distributions (gray symbols) for the Calhoun CZO (30 m resolution NASA SRTM DEM, covering an area of approximately 3000 km2) are compared to Gaussian and Rayleigh distributions (blue lines), respectively (results for the other five CZOs are shown in the supporting information). The logarithmic plot of the slope distributions shows the power‐law scaling of the pdf tail: the power‐law exponent β=−9.85 is computed by fitting the power law tail (black line) between p(S)=10−3.2 and p(S)=10−0.95 (dashed lines), as in Bonetti and Porporato (2017) (BP17). (c) The power‐law exponents computed for all the CZOs are used to infer approximate landscape ages based on the rate of decay dβ/dT (black line). Gray diamonds show results from BP17 (dark gray for the Appalachians). Detailed information about the CZOs analyzed here and the DEMs used is provided in the supporting information.
Intensive agricultural land use can have detrimental effects on landscape properties, greatly accelerating soil erosion, with consequent fertility loss and reduced agricultural potential. To quantify the effects of such erosional processes on hillslope morphology and gain insight into the underlying dynamics, we use a twofold approach. First, a statistical analysis of topographical features is conducted, with a focus on slope and gradient distributions. The accelerated soil erosion is shown to be fingerprinted in the distribution tails, which provide a clear statistical signature of this human‐induced land modification. Theoretical solutions are then derived for the hillslope morphology and the associated creep and runoff erosion fluxes, allowing us to distinguish between the main erosional mechanisms operating in disturbed and undisturbed areas. We focus our application on the landscape at the Calhoun Critical Zone Observatory in the US Southern Piedmont, where severe soil erosion followed intensive cotton cultivation, resulting in highly eroded and gullied hillslopes. The observed differences in hillslope morphologies in disturbed and undisturbed areas are shown to be related to the disruption of the natural balance between soil creep and runoff erosion. The relaxation time required for the disturbed hillslopes to reach a quasi‐equilibrium condition is also investigated.
Citation
Bonetti, Sara, Daniel D. Richter, Amilcare Porporato (2019): The effect of accelerated soil erosion on hillslope morphology. Earth Surface Processes and Landforms 44(15): 3007-3019. DOI: 10.1002/esp.4694
 This Paper/Book acknowledges NSF CZO grant support.
Explore Further
