Optimal Sensing
Topographically-derived spatial soil moisture model and application to optimal sensor location
A topographically-explicit soil moisture model is developed and applied to cluster watershed into homogeneous sampling regions
Model Category: Numerical
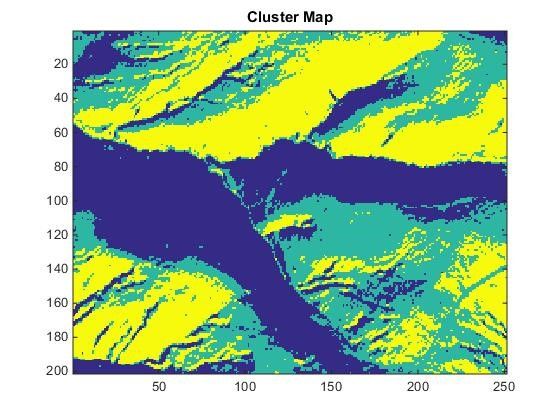
Image: A clustering of the watershed based on rank stability.
-
Calhoun, GRAD STUDENT
-

Calhoun, INVESTIGATOR
-

Calhoun, INVESTIGATOR
We developed a spatial soil moisture model that is parameterized using local topographic information obtained from a Digital Elevation Model (DEM): including slope, aspect, and contributing area. The model includes lateral redistribution according to the Richards equation. This allows us to simulate a space-time soil moisture field in which the soil moisture values and the parameters controlling them are known exactly at each point. Simulations have been performed for Calhoun CZO watersheds.
Various methods to determine optimal sampling points and to partition watersheds into clusters that share certain traits have been explored. The aim is to sample the fewest number of points which yield the maximum amount of information about the soil moisture state of the watershed as a whole. One such clustering method utilizes rank stability analysis to identify the typical distance of individual points in the watershed from the mean behavior of the entire watershed. This could be extended to indicators of interest other than the areal mean, such as soil moisture wilting point and field capacity.
Optimal sampling methods are an important component of CZO research, which depends on reliable data acquisition. Critical zone processes are often difficult to measure at large scales and exhibit large spatial and temporal variability.
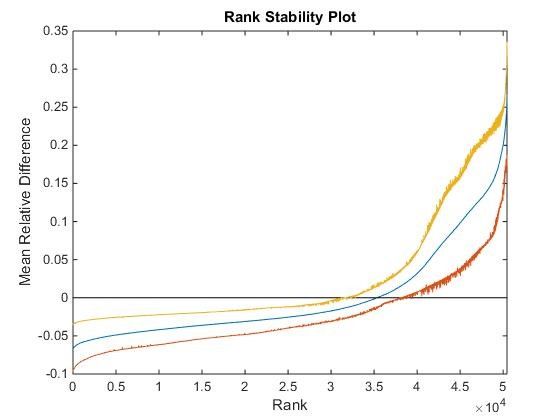
For a simulated soil moisture time-series in the Calhoun CZO, a simple rank stability plot (above) and a clustering of the watershed based on rank stability (at top of page).
For a simulated soil moisture time-series in the Calhoun CZO, a simple rank stability plot (above) and a clustering of the watershed based on rank stability (at top of page).
Publications
2015
Description of topographically-derived spatial soil moisture patterns and finding optimal sampling points. Pelak, N. (2015): Calhoun CZO 2015 Summer Science Meeting
Explore Further
