Geomorphology Research Group
Geomorpholoy team aims to increase understanding of the processes which control landscape shape and thickness, as well as the feedbacks between hydrology, biology, weathering, and erosion.
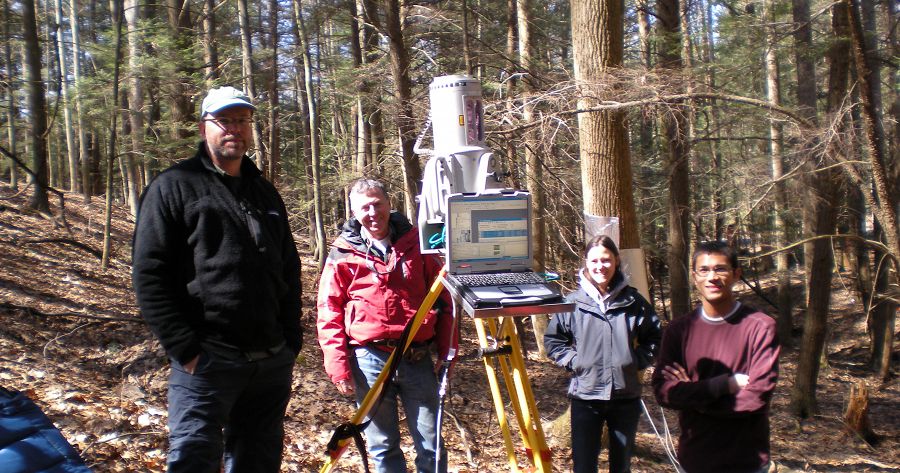
Image: Terrestrial, tripod-mounted LiDAR (Light Detection and Ranging) scans the topography of the catchment from multiple points for high-resolution imaging of micro-topography along hillslopes.
This group is tagged with:
-
The geomorphology working group is examining three fundamental questions at the Shale Hills CZO and surrounding region (Fig. 1):

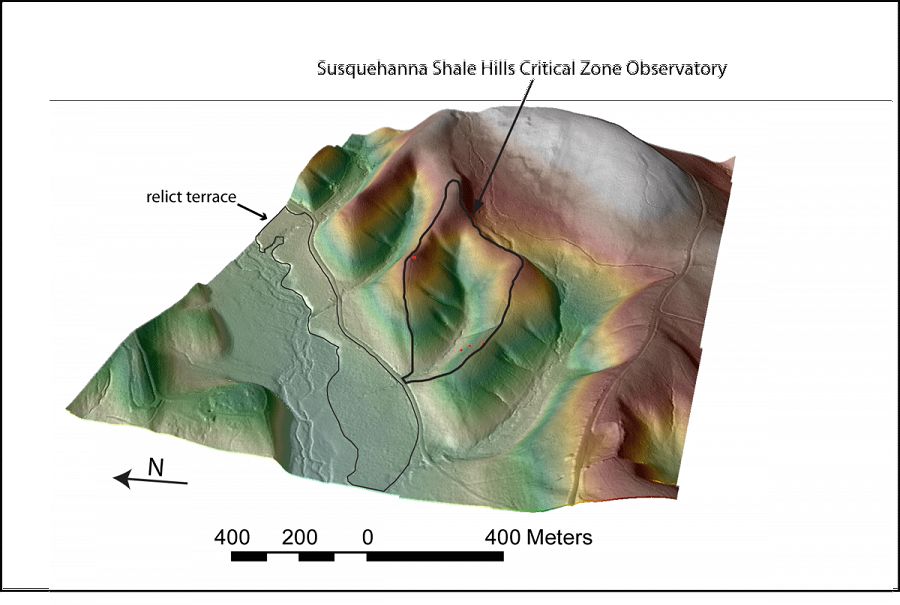
Figure 1: Perspective view of a shaded-relief image generated from high-resolution LiDAR topographic data. The relict braided stream in the foreground with alluvial terraces is interpreted to have formed during earlier time periods of increased sediment yield associated with active hillslope transport under periglacial conditions. Adjustments in this trunk stream are suspected to have changed base level for the SHO watershed.
1) What are the primary processes and rate laws that set the shape of the landscape and the thickness & properties of the Critical Zone?
2) What are the dynamics of feedbacks between hydrology, biology, weathering, and physical erosion?
3) How have the processes and products of the SHO regolith mill changed in response to past climatic, base level, and land-use perturbations?Question 1: Primary processes and rate laws
We are approaching the question of what controls soil erosion and downslope transport from both a theoretical and empirical perspective.Ongoing theoretical efforts include development of a hillslope sediment flux model that incorporates tree-throw and freeze-thaw creep. Model development also includes improvement of overland and channel flow formulations to simulate unsteady non-uniform flows. Validation experiments will employ LiDAR and regolith thickness data being collected onsite.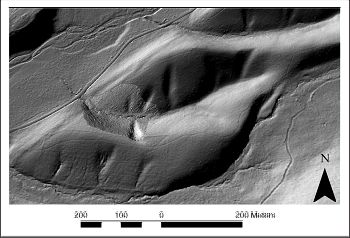
Figure 2a: Shaded relief of the SHO watershed, with an overlay generated from terrestrial laser scanning of topography. Note the sub-meter scale roughness associated with pit-and-mound topography interpreted to represent relict tree-throw events.
We are also conducting field-based experiments designed to quantify the rate of regolith formation, the role of tree-throw in the downslope transport of material, and the residence time of material in regolith.
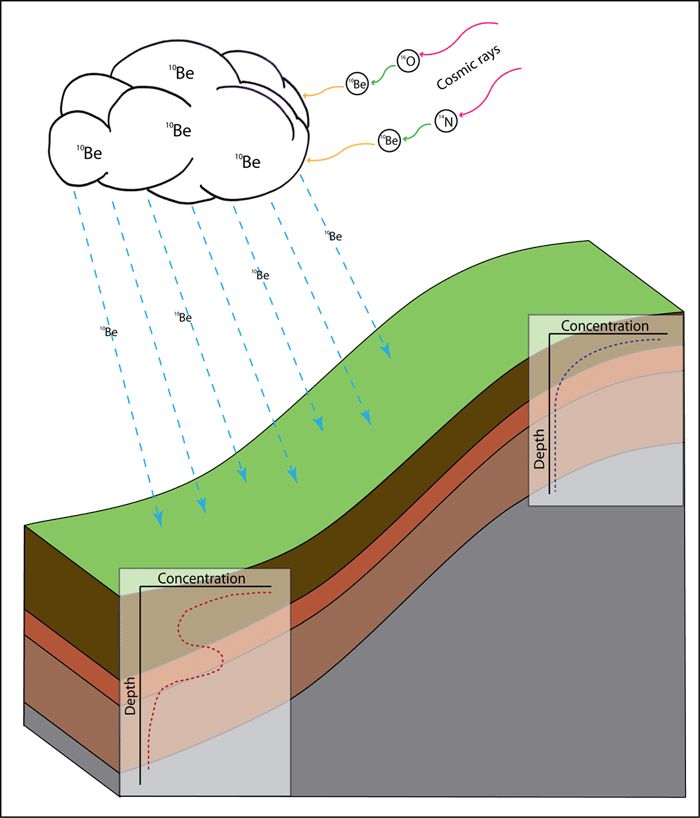
These experiments combine high-resolution topographic surveys (using terrestrial laser scanning, Fig. 2a) to characterize the spatial density of pit-and-mound topography associated with tree-throw with field calibration of the material transported per event (Fig. 2b). In addition, we are using the spatial distribution of meteoric 10Be along hillslope transects (Fig. 3) to estimate the residence time of regolith materials near the surface and the rate at which these move downslope.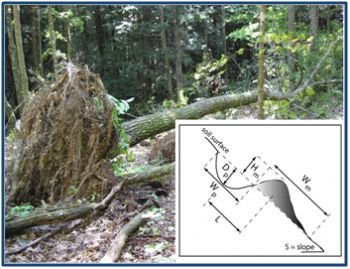
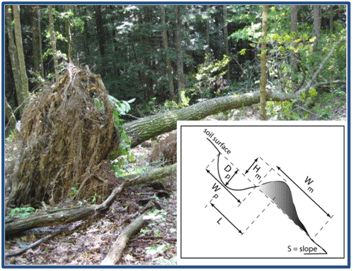
Figure 2b: Field photograph of recent tree-throw event. Inset shows geometric properties of pit-and-mound topography.

Figure 3: Schematic representation of the use of meteoric 10Be as a tracer of sediment flux on hillslopes. Meteoric 10Be is produced during spallation reactions between cosmic-rays and 16O and 14N in the atmosphere where is then delivered to the ground surface via precipitation. Accumulation in regolith over geologic time is a function of both delivery rate and the residence time of regolith material in the watershed. Profile shape frequently follows either a declining trend with depth or exhibits a bulge shape, which is controlled by particle size and mineralogy.
Question 2: Feedbacks in the landscape/regolith system
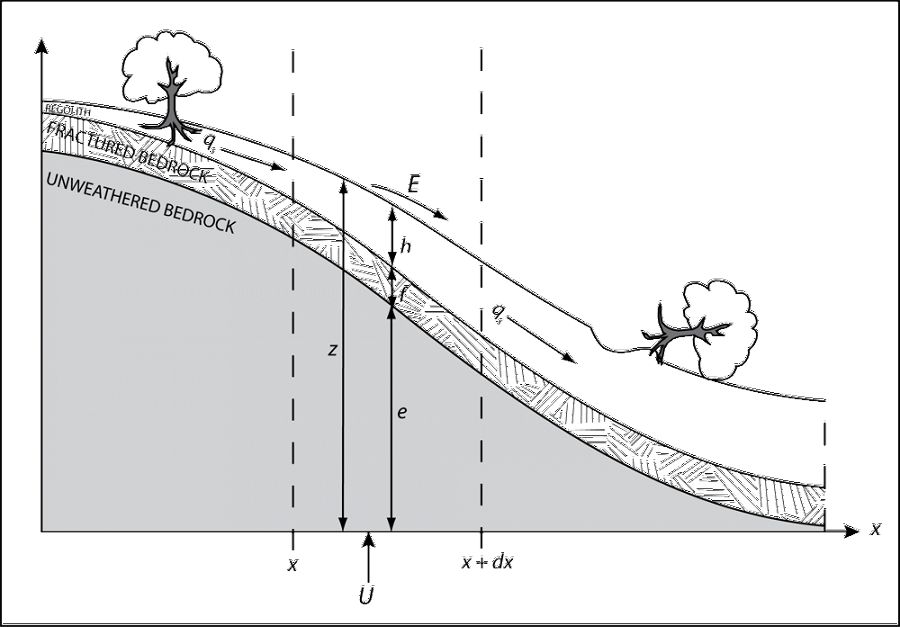
Transport laws relating sediment transport, erosion, and deposition are being incorporated into the Penn State Integrated Hydrologic Model (PIHM) and implemented in numerical simulations designed to illuminate the nature and direction of feedbacks among processes acting within the Critical Zone. The fully integrated hydrologic/sediment flux model (PIHMSed) includes feedbacks between soil thickness, downslope sediment flux due to rate of tree-throw, rate of regolith conversion from bedrock, evolving soil moisture, and solute fluxes. Three domains (Fig. 4) all co-evolve to produce different steady-state landscapes, depending upon the external forcing conditions.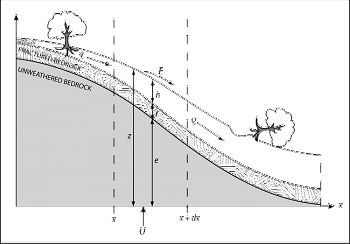
Figure 4: Definition sketch of hillslope where z = ground surface elevation (m), e = bedrock interface elevation (m), f = fracture zone thickness (m), h = regolith thickness measured in the vertical (m), U = rock uplift rate (m yr-1), E = net erosion/deposition rate (m yr-1) on the surface by overland flow, and qsx = volumetric flux of regolith (m3 m-1 yr-1). These form the basis for transport laws implemented in PIHM.
Question 3: Dynamic evolution of the SHO over geologic time
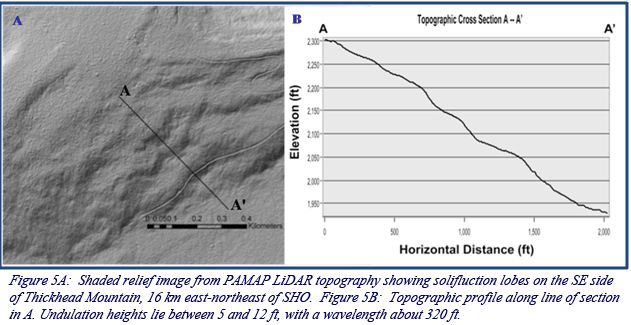
The thickness of regolith and the efficiency of the weathering engine in the SHO has been influenced by perturbations in both the geologic and recent past. Ongoing efforts are focused on understanding the response of Critical Zone processes to enhanced sediment production and hillslope transport during periglacial times.Analysis of high-resolution digital elevation models (generated from airborne laser altimetry surveys) reveals abundant periglacial features such as solifluction lobes (Fig. 5) in the region, as well as evidence for previous periods of aggradation along fluvial systems (Fig. 1). Using a combination of coring and subsurface imaging (using ground-penetrating radar), we are currently exploring whether these processes generated deposits that are present in the subsurface of SHO, and, if so, to what degree they influence chemical and isotopic measures of weathering and soil production.
Figure 4: Definition sketch of hillslope where z = ground surface elevation (m), e = bedrock interface elevation (m), f = fracture zone thickness (m), h = regolith thickness measured in the vertical (m), U = rock uplift rate (m yr-1), E = net erosion/deposition rate (m yr-1) on the surface by overland flow, and qsx = volumetric flux of regolith (m3 m-1 yr-1). These form the basis for transport laws implemented in PIHM.
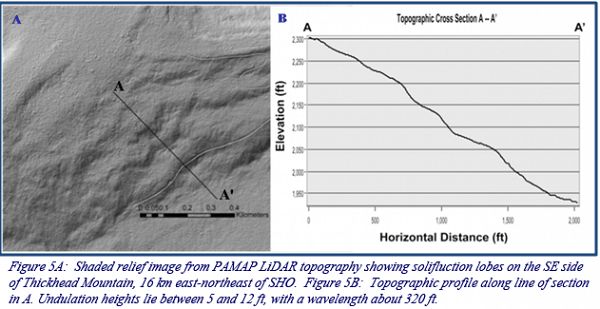
Figure 5A: Shaded relief image from PAMAP LiDAR topography showing solifluction lobes on the SE side of Thickhead Mountain, 16 km east-northeast of SHO. Figure 5B: Topographic profile along line of section in A. Undulation heights lie between 5 and 12 ft, with a wavelength about 320 ft.
We anticipate that these investigations will inform our understanding of the degree to which antecedent conditions “preconditioned” the landscape and materials now incorporated in the Critical Zone.
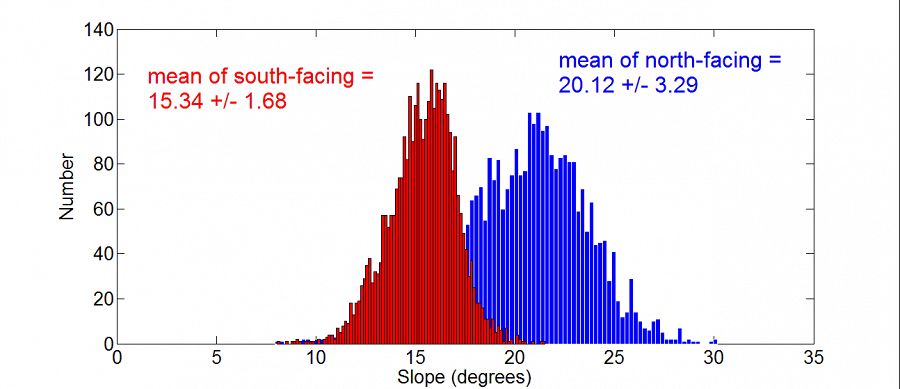
For example, hillslopes along east-west oriented hillslopes within the CZO and nearby catchments exhibit systematic differences in gradient (Fig. 7). We speculate that this difference reflects more efficient hillslope transport during vigorous periglacial activity in the past, but acknowledge that such differences may still be reflected in the modern transport and weathering regime.
Figure 6: Topographic differences in average gradient on north and south facing slopes within the SHO.

Figure 7: Hillslopes along east-west oriented hillslopes within the CZO and nearby catchments exhibit systematic differences in gradient
Contacts: Rudy Slingerland (PI), Eric Kirby (PI), and Nicole West (Ph.D. Student)
Collaborators: Paul Bierman (University of Vermont)Figure 1: Perspective view of a shaded-relief image generated from high-resolution LiDAR topographic data. The relict braided stream in the foreground with alluvial terraces is interpreted to have formed during earlier time periods of increased sediment yield associated with active hillslope transport under periglacial conditions. Adjustments in this trunk stream are suspected to have changed base level for the SHO watershed.
Figure 2a: Shaded relief of the SHO watershed, with an overlay generated from terrestrial laser scanning of topography. Note the sub-meter scale roughness associated with pit-and-mound topography interpreted to represent relict tree-throw events.
Figure 2b: Field photograph of recent tree-throw event. Inset shows geometric properties of pit-and-mound topography.
Figure 3: Schematic representation of the use of meteoric 10Be as a tracer of sediment flux on hillslopes. Meteoric 10Be is produced during spallation reactions between cosmic-rays and 16O and 14N in the atmosphere where is then delivered to the ground surface via precipitation. Accumulation in regolith over geologic time is a function of both delivery rate and the residence time of regolith material in the watershed. Profile shape frequently follows either a declining trend with depth or exhibits a bulge shape, which is controlled by particle size and mineralogy.
Figure 4: Definition sketch of hillslope where z = ground surface elevation (m), e = bedrock interface elevation (m), f = fracture zone thickness (m), h = regolith thickness measured in the vertical (m), U = rock uplift rate (m yr-1), E = net erosion/deposition rate (m yr-1) on the surface by overland flow, and qsx = volumetric flux of regolith (m3 m-1 yr-1). These form the basis for transport laws implemented in PIHM.
Figure 5A: Shaded relief image from PAMAP LiDAR topography showing solifluction lobes on the SE side of Thickhead Mountain, 16 km east-northeast of SHO. Figure 5B: Topographic profile along line of section in A. Undulation heights lie between 5 and 12 ft, with a wavelength about 320 ft.
Figure 6: Topographic differences in average gradient on north and south facing slopes within the SHO.
Figure 7: Hillslopes along east-west oriented hillslopes within the CZO and nearby catchments exhibit systematic differences in gradient
-
Contacts
-
Shale Hills, INVESTIGATOR
-
Shale Hills, INVESTIGATOR
6 People
 .(JavaScript must be enabled to view this email address)
Geomorphologist and Geochemist

INVESTIGATOR
.(JavaScript must be enabled to view this email address)
Geomorphology

INVESTIGATOR, COLLABORATOR
.(JavaScript must be enabled to view this email address)
Geology, Geomorphology

INVESTIGATOR
.(JavaScript must be enabled to view this email address)
Geomorphology

INVESTIGATOR, COLLABORATOR
.(JavaScript must be enabled to view this email address)
Earth Surface Processes and Critical Zone Science
Alumni-Former

INVESTIGATOR, PostDoc
Geomorphology, Geophysics, Landscape Evolution

GRAD STUDENT
.(JavaScript must be enabled to view this email address)
Geomorphology
-
-
Featured Publications
2011
Preliminary estimates of regolith generation and mobility in the Susquehanna Shale Hills Critical Zone Observatory, Pennsylvania, using meteoric 10Be. West, N., Kirby, E., Bierman, P., Rood, D. (2011): Applied Geochemistry v.26, S146 – S148


Explore Further
