Hydroinformatics Research Group
This group is tagged with:
-
Real-time hydrologic forecast system (now cast): The future of hydrologic forecast system will utilize monitoring station networks with continuous real-time measurement of a branch of informatics, including hydrologic, atmospheric, and pedologic variables across diverse terrestrial water cycle. The research provides a framework to implement a physical-based integrated hydrologic model (Penn State Integrated Hydrologic Model) for real-time hydrologic forecast, and targets a feedback strategies gaining model improvement from forecasting results. Two research questions are being asked:
1) How can we continuously improve the model simulation error and forecast efficiency?
2) How should we optimize the monitoring station networks to improve performance of the
real-time hydrologic forecast system?Forcing data and initial conditions are major inputs of hydrologic model. A real-time hydrologic monitoring network has been developed to support data observation. The preliminary Real-time Forecast Framework will incorporate a data monitoring system with a hydrologic modeling system. There are two modeling systems involved (one for forecast, one for real-time simulation) running independently. Both the systems keep checking if the forcing data is updated. Once forcing data is updated, the corresponding system will restart from the last stop of real-time simulation with the state variable of real-time simulation as initial condition, and move forward until the end of the updated forcing data.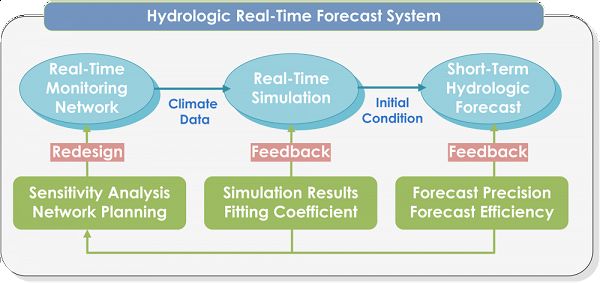

Forecast Results:
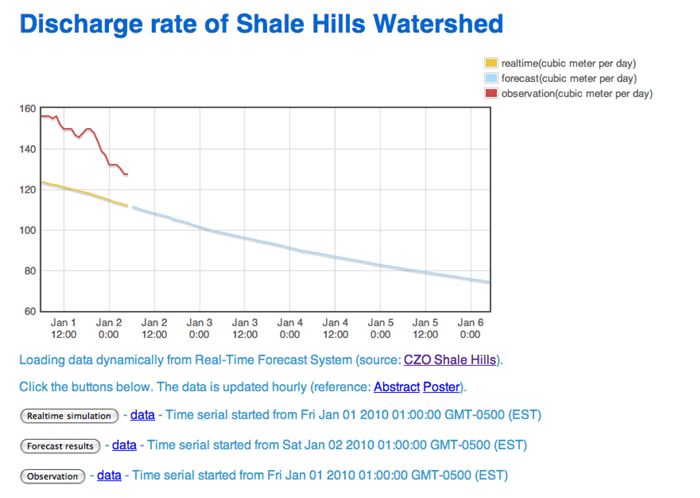
2009 data is used as a prototype, before we implement the actual weather forecast.
The model started at 2009-1-1. Weather forecasting data came from the observation data with a slight random fluctuation in precipitation and temperature. We are adding to forcing data with one-day records every hour. The forcing data for forecast is three days longer than that of real-time simulation, which represents the weather forecasting results. So we are doing one-day real-time simulation and three-day forecast.
A simple webpage of discharge rate shows system output in Figure 2. Real-time simulation starts one day ahead, and forecast model ends three days after.
Discharge rate of Shale Hills Watershed
For more information contact:
Christopher Duffy (PI),
Xuan Yu (Ph.D student), Gopal Bhatt (Ph.D student), Lorne Leonard (Ph.D student)
Figure 1. Real-Time Forecast System Network
Figure 2. Discharge rate from Jan 1- 6, 2011.
Figure 3. Forecast error of groundwater levels for one day, specifically 06/20/09.
-
Contacts
-
Shale Hills, INVESTIGATOR
2 People

INVESTIGATOR
.(JavaScript must be enabled to view this email address)
Penn State
Stochastic and numerical modeling of groundwater flow and solute transport, modeling large-scale hydrologic systems.
 .(JavaScript must be enabled to view this email address), (814)865-0294
GIS, Water Quality, Data Management
Alumni-Former

GRAD STUDENT
Wetland hydrology, hyporheic hydrology, Distributed watershed modeling for ecosystem services
-

Explore Further
